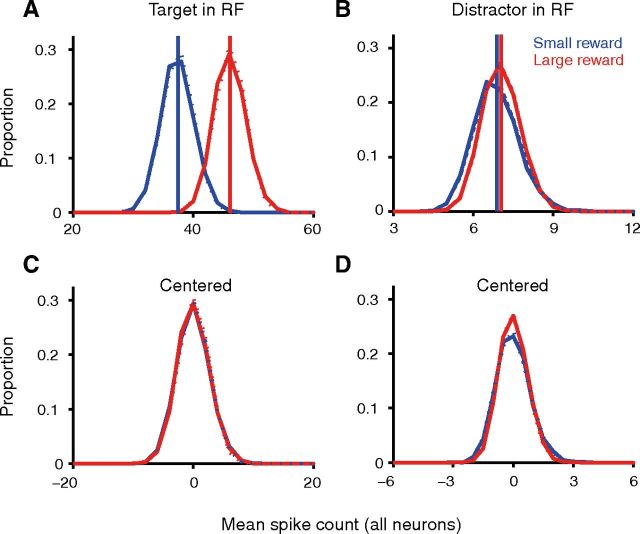
Figure 6.
A negative-binomial model fit captures the effects of expected reward on the spike count distribution. A–D, Blue and red indicate small and large rewards, respectively. Solid lines are frequency polygons of the distribution of mean spike count across all recorded neurons (n = 35 neurons with target in RF in A and C; n = 40 neurons with distractor in RF in B and D; only neurons with variance greater than or equal to the mean and at least 10 trials for both large and small reward conditions are included): one randomly chosen trial from each neuron was used to compute a mean spike count, and the distribution of the mean spike count was estimated by repeating the process 25,000 times. Dotted lines (appearing almost superimposed on the solid ones) are similar, except that the sum was calculated by randomly drawing one count from the best-fitting negative-binomial model to each neuron's distribution rather than from the data itself; vertical lines in A and B indicate the theoretical means of these distributions. C and D show the data from A and B after subtracting the mean to center the distributions. Spikes were counted in the epoch from 400 ms before to 500 ms after distractor onset for the target in RF condition (A, C), and from 470 ms before to 30 ms after distractor onset for the distractor in RF condition (B, D).

