Figure 3.

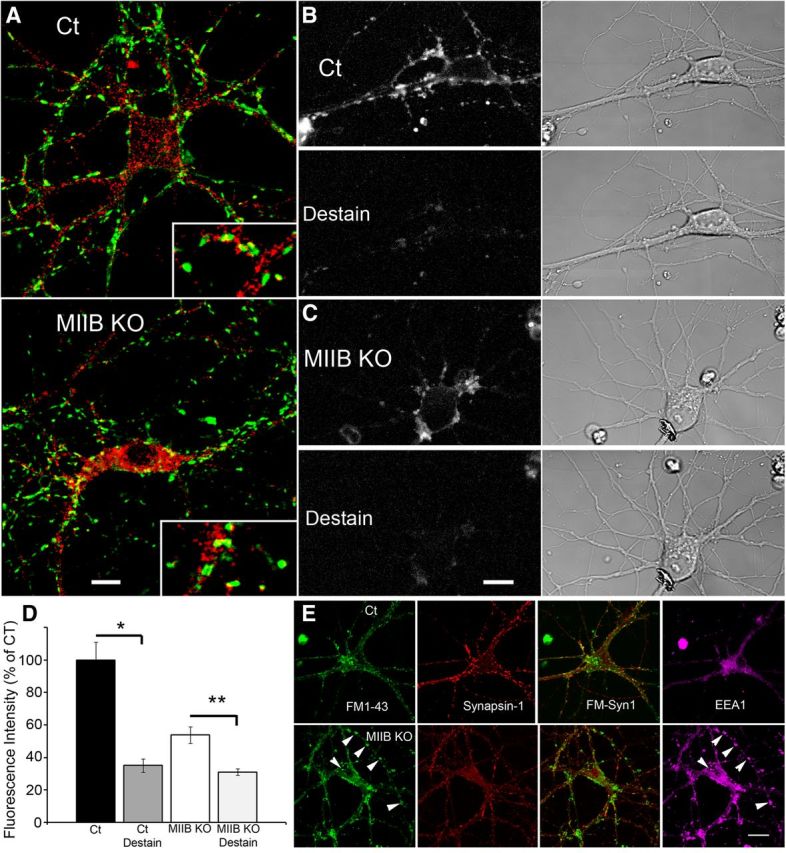
Glutamate receptor (AMPA, GluR1) distribution appears relatively normal in MIIB KO neurons, but MIIB KO neurons show decreased uptake and release of FM1–43. A, Comparison of glutamate receptor distribution in Ct and MIIB KO cells costained with an antibody to synaptobrevin (green) and the glutamate receptor (red). There are no readily apparent differences in receptor distribution or staining intensity. Scale bar, 11 μm. B, Top, (Fluorescence and DIC) show a control neuron after loading FM1–43 with a 5 min K+ depolarization. Just below, is the same cell after a second 2 min K+ depolarization to cause release (destaining) of FM1–43. C, MIIB KO neuron treated as in B. FM1–43 puncta are less bright after loading with FM1–43, but destaining appears to be equally efficient. D, Quantitative analysis of FM1–43 staining and destaining of individual puncta. (Ct, * decrease was significant; t test, p < 0.001, N = 37 puncta from 3 circuits). MIIB KO neurons have fewer and dimmer puncta, but show a significant decrease in fluorescence intensity upon destaining to the same levels as Ct cells (error bars indicate SEM; ** t test, p < 0.001, N = 26 puncta from 3 circuits). E, A Ct cell imaged while live showing FM1–43 uptake (top left) in response to K+ depolarization (10 min). Synapsin-1 immunofluorescence (second part) shows a similar distribution to the FM1–43 fluorescence. Superimposition of the two labels (third part) shows a high degree of correspondence. EEA1 immunofluorescence staining (right) shows a low degree of overlap with FM1–43 and synapsin-1 staining. A MIIB KO cell imaged after fixation (bottom left) showing the FM1–43 uptake in response to K+ depolarization (10 min; the live image was very similar). Multiple bright accumulations are apparent (arrowheads). Synapsin-1 immunofluorescence (second part) shows partial overlap with the FM1–43 staining, but less than that seen in the Ct. The bright FM1–43 accumulations show little overlap with synapsin-1 staining. EEA1 staining (right) shows a high degree of overlap with the FM1–43 staining in extrasynaptic areas (arrowheads). Scale bar, 18 μm.
