Figure 4.
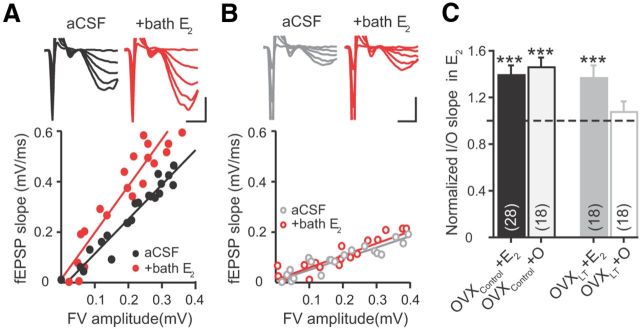
Acute effect of E2 on synaptic transmission. A, B, Top, Voltage traces from a OVXControl + E2 (A) and an OVXLT + O rat (B), acquired before (black or gray) and after bath application of E2 (red). Calibration: 0.5 mV, 2 ms. Bottom, I/O relations from the same experiments. The I/O slopes from these examples are as follows: OVXControl + E2, aCSF, 1.37 ± 0.07; +bath E2, 1.86 ± 0.15; OVXLT + O, aCSF, 0.44 ± 0.04; +bath E2, 0.48 ± 0.04. C, Summary bar graphs of I/O slopes in the presence of E2 (normalized to control values). Numbers in the parentheses denote the numbers of independent CA3–CA1 pathways tested, from the following: OVXControl + E2, three rats, 15 slices; OVXControl + O, three rats, 10 slices; OVXLT + E2, four rats, 9 slices; and OVXLT + O, four rats, 10 slices. ***p ≤ 0.001 following bath application of E2 (relative to baseline recordings in control aCSF).

