
Figure 3.
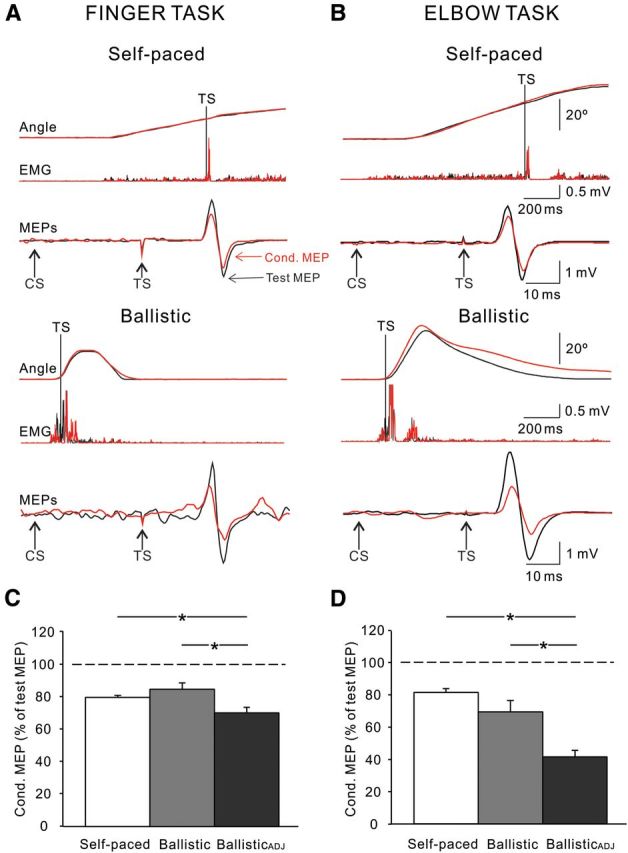
IHI during movement execution. A, B, IHI tested in the index finger (A) and elbow (B) tasks of a representative subject during the execution phase of self-paced (top traces) and ballistic (bottom traces) movements. The test and conditioned (Cond.) MEP are indicated by black and red arrows, respectively. Traces above MEPs show the rectified EMG activity and angular displacement during each movement condition. Vertical lines show the time of the TS during IHI testing. Arrows indicate the time points at which the TS and CS are delivered. C, D, Group data (index finger task, n = 11, C; elbow task, n = 8, D). The abscissa shows all conditions tested (self-paced, ballistic, and ballisticADJ). The ordinate shows the magnitude of the conditioned MEP expressed as a percentage of the test MEP. The horizontal dashed line represents the size of the test MEP. Note the decrease in IHI during ballisticADJ index finger and elbow movements. No changes in IHI were observed in the ballistic condition compared to self-paced movements in the unadjusted condition. Error bars indicate SEs. *p < 0.05.