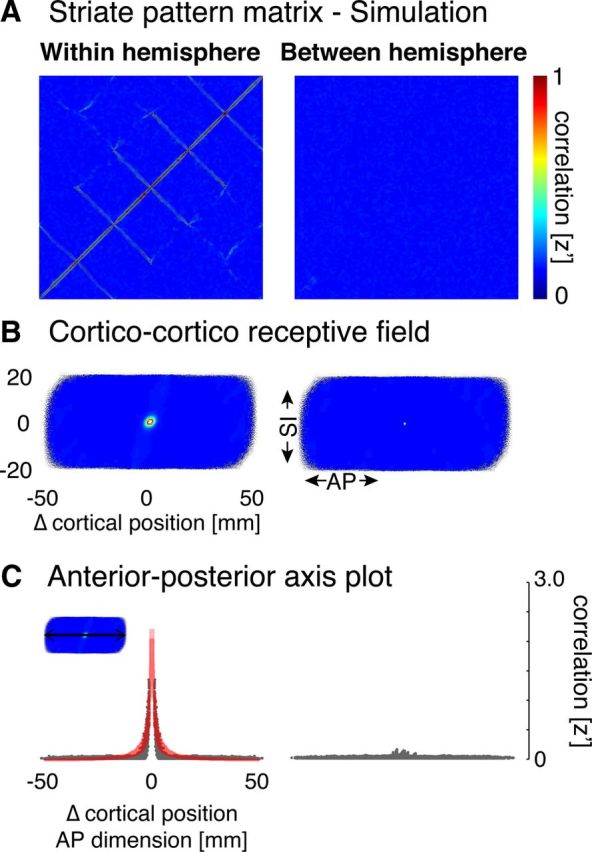
Figure 2.

Pattern matrices for simulated fMRI data. A, Within- and between-hemisphere striate pattern matrices. Normally distributed, pseudorandom data were passed through the particular anatomical and image processing routines for 9 randomly selected subjects. The resulting pattern matrices for simulated data were averaged following a Fisher's r-to-z transformation. Structure about the diagonal of the matrix is readily apparent in the within-hemisphere matrix, which we term “digital image structure.” B, Corticocortico receptive field depictions derived from the pattern matrices. Correlation data depicted in A are replotted for the receptive field view by change (in millimeters of cortex) along the AP and SI dimensions. A local, circular area of high correlation within 10 mm of each vertex is seen for the within-hemisphere simulation. C, AP axis plots. A cross-section along the AP dimension of each receptive field plot is shown. Each gray point indicates a given pairing of vertices, with the position along the x-axis given by the distance between the points in millimeters along the AP axis. Red represents the fit of the decaying exponential model.
