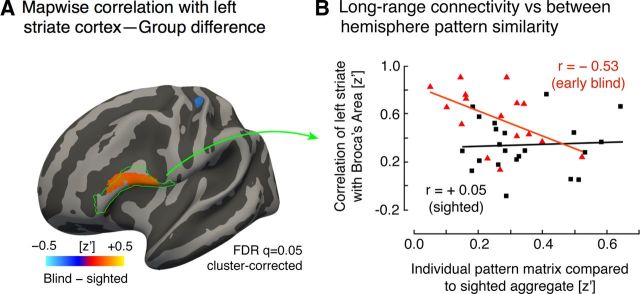
Figure 7.
Differences in striate cortex long range correlation and its relation to pattern similarity. A, Whole-brain group difference in correlation with mean left-hemisphere striate cortex signal. Red represents a larger average correlation with the left striate cortex in the blind group compared with the sighted controls. No differences at this map-wise threshold were found either on the medial surface of the brain or the right hemisphere. The location of Broca's area is indicated in green outline (defined as the union of the pars opercularis and pars triangularis). B, Long-range correlation versus interhemispheric pattern similarity. The between-hemisphere pattern similarity measure from each subject (Fig. 6B) was related to the correlation between the left striate cortex and Broca's area. A significant relationship between these measures was observed for blind group (red triangles), but not for the sighted group (black squares).

