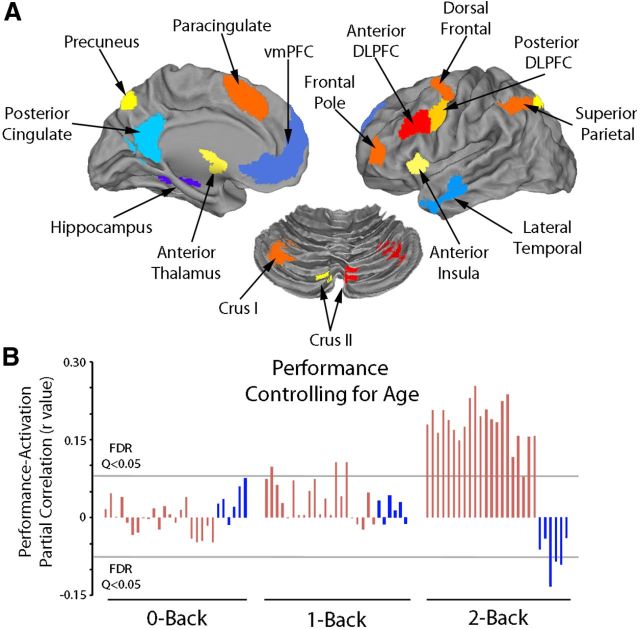
Figure 7.
Relationship between performance and activation in functional ROIs within the executive network and DMN. A, Regions of interest: the executive network (warm colors) was parsed into 21 functional regions of interest by applying a watershed algorithm to the map of the 2-back > 0-back contrast using an initial threshold of z > 20. Six regions of interest in the default mode network were similarly constructed from the contrast of 0-back > 2-back. B, Activation in each of these regions within the executive network (and deactivation of certain default mode regions) was significantly associated with better performance mainly at the highest (2-back) levels of WM load. In contrast, associations with age in these regions did not survive multiple comparison correction at any level of WM load. The y-axis depicts partial correlation at each level of WM load (0-back, 1-back, 2-back) from each of the 21 executive network regions (red) and 6 default mode regions (blue), displayed in A. Partial correlations were calculated between region percentage signal change and performance while accounting for age, sex, and in-scanner motion.

