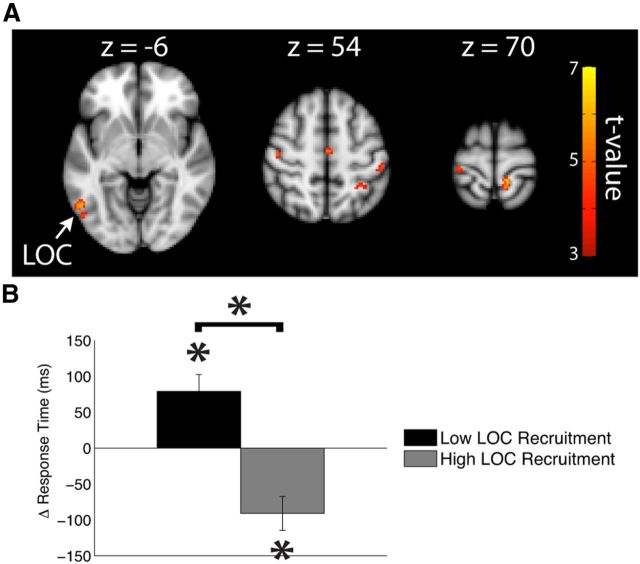
Figure 4.
Whole-brain contrasts between actual rTMS and sham rTMS during the RF encoding period. A, Left LOC (left), left supplementary motor (middle), right superior parietal lobule (middle), and bilateral postcentral gyrus (middle and right) became more active during face encoding after rTMS. B, Participants who recruited LOC more after rTMS yielded enhanced response time performance (gray bar), whereas those who used LOC less exhibited rTMS-related declines in performance (black bar). Δ = rTMS − sham rTMS. *p < 0.05. Error bars reflect standard error.

