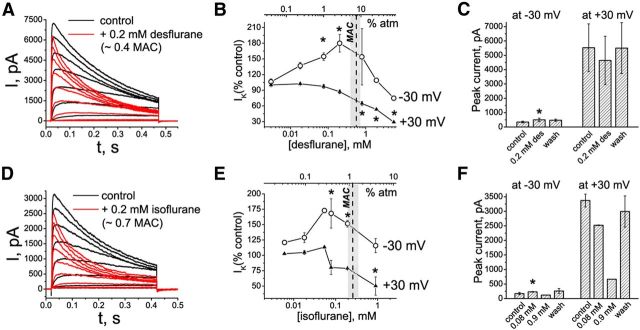
Figure 6.
Modulation of Kv1.3 channel properties by desflurane and isoflurane. A, D, Representative current traces evoked by depolarizing pulses from a holding potential of −80 mV to the range of potentials from −40 to +30 mV, with 10 mV increments and interpulse intervals of 30 s. Control currents are superimposed with currents recorded in the presence of desflurane (A) or isoflurane (D). B, C, E, F, Dose-dependence relationships for the effects of desflurane (B, C) and isoflurane (E, F) on potassium currents evoked by depolarizing voltage steps from −80 to −30 and +30 mV. The light gray area shows the surgical range of anesthetic concentrations; the dash line indicates the approximate MAC value for the corresponding anesthetic in mice and in human patients of middle age. The row data are normalized to control peak IK+ values and are presented as mean ± SEM (n = 3–5 measurements for each concentration). Statistical analysis was performed on row data before normalization, and the significant differences are indicated by asterisks (pairwise comparisons, Tukey's test). C, F, Averaged peak IK+ values in the presence of desflurane (C) and isoflurane (F) in control conditions and after washing out the anesthetics. The data are presented as mean ± SEM; n = 3 cells. *p < 0.05 (paired t test). The cells were exposed to aqueous anesthetic solutions prepared as described previously (Mandal and Pettegrew, 2008).

