
Figure 10.
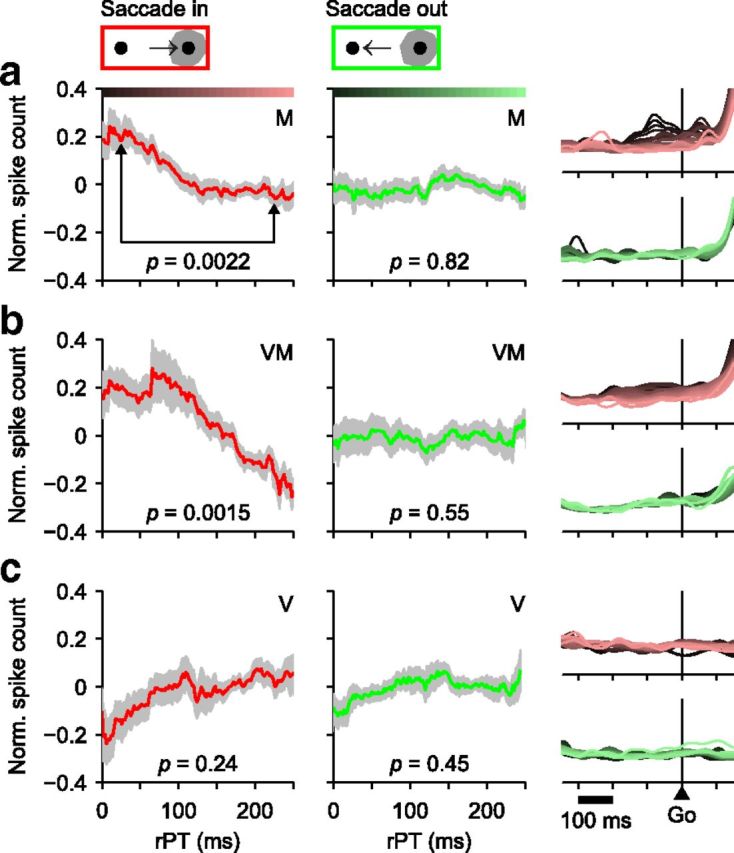
The neural correlate of choice bias varies across neuronal types. a, Normalized activity before the Go as a function of rPT for 26 spatially selective M neurons. Responses for each neuron were aligned on the Go. Spike counts in the analysis window (250 ms before to 20 ms after the Go) were calculated for all trials, turned into z scores, grouped according to rPT (bin width = 80 ms), and averaged across neurons. Data were analyzed separately for trials into (red, left column) and away (green, middle column) from the RF. Gray shades indicate ±1 SE across neurons. Significance values shown (p, from permutation test) are for the difference in activity across the two rPT bins indicated (rPT = 25 and 225 ms). Color bars indicate rPT bins for the firing rate traces shown on the rightmost column, for which the mean firing rate of each neuron in the analysis window was normalized to 1. b, As in a, but for 19 spatially selective VM neurons. c, As in a, but for 18 V neurons.