
Figure 12.
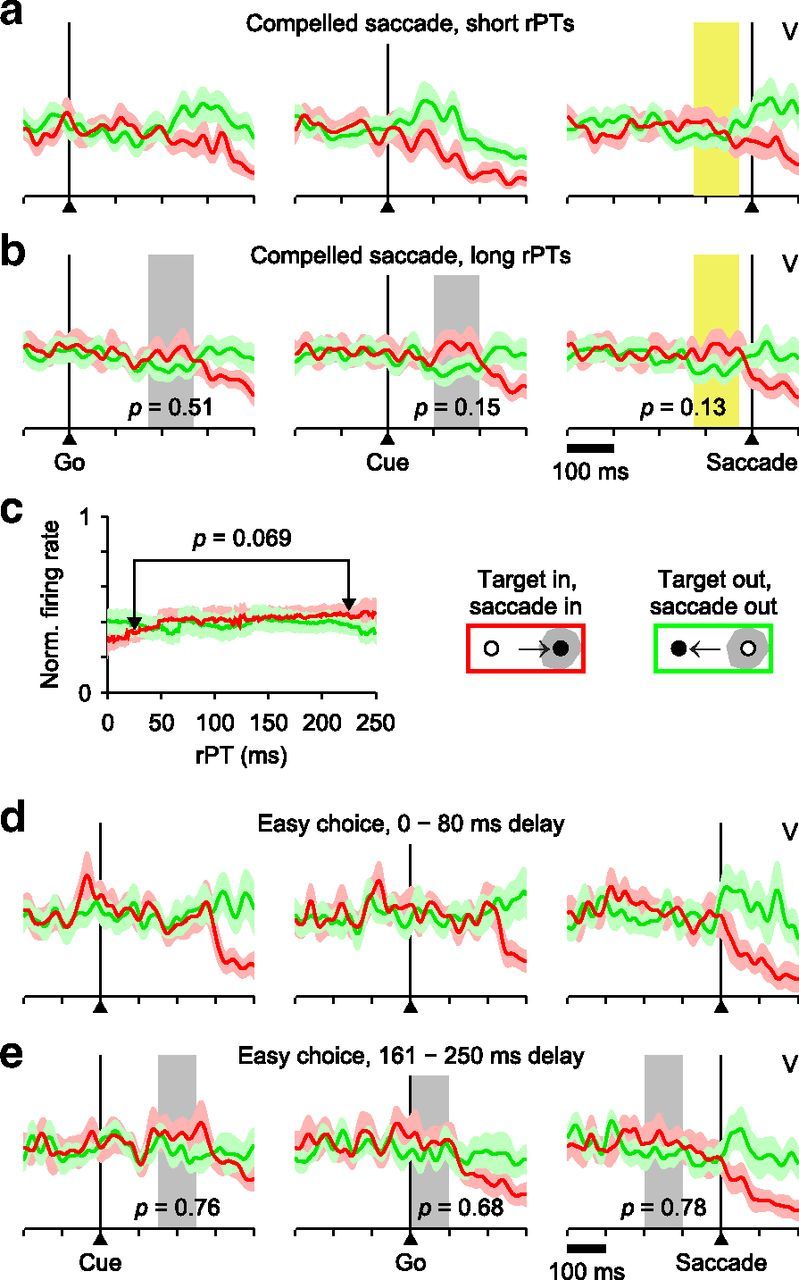
Scant evidence of perceptual modulation in V neurons. a, Activity of 18 V neurons recorded in the CS task and aligned on the Go signal (left), Cue (middle), or saccade onset (right) in short-rPT trials. Red and green traces are for target and distracter in the RF, respectively. b, As in a, but for long-rPT trials. Short-rPT and long-rPT ranges are as in Figure 4e. Differences between target- and distracter-related responses within chosen time windows (gray and yellow shades) were evaluated through permutation tests (p values shown). c, Mean V responses as functions of rPT. Firing rates were computed in a 100 ms time window preceding saccade onset (yellow shades in a and b) for all trials within each rPT bin (bin width = 80 ms). The window was centered on the mean Cue onset time of the long-rPT trials used in b, plus 150 ms. The shown p value is for the target-related response compared across the two rPT bins indicated (rPT = 25 and 225 ms, permutation test). d, Responses of 12 V neurons during short-delay trials of the easy-choice task. e, As in d, but for long-delay trials. Gray shades indicate time windows for which target- and distracter-related responses were compared (p values shown; permutation test).