Figure 3.
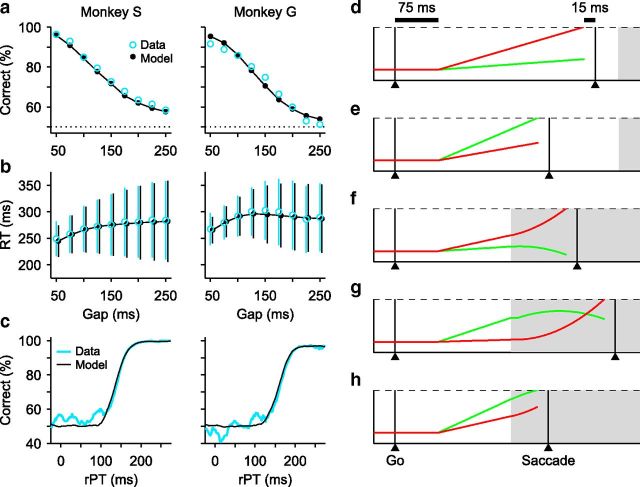
Psychophysical and model performance on the CS task. a, Percentage of correct responses as a function of Gap, or psychometric curve. b, Mean RT (±1 SD) as a function of Gap, or chronometric curve. c, Percentage of correct responses as a function of rPT (equal to RT − Gap), or tachometric curve. In a–c, experimental data (blue lines and data points) correspond to behavior during the recording sessions of 119 FEF neurons from monkey S (74 cells, 18,293 trials) and monkey G (45 cells, 7953 trials). Model results (black lines and data points) are from computer simulations of the accelerated race-to-threshold model. d–h, Five simulated trials. The two competing variables xR (red) and xL (green) represent oculomotor activity that triggers an eye movement either to the right or to the left, respectively. In these examples the target is on the right, so races in which xR wins produce correct choices. The two variables start racing 75 ms (afferent delay) after the Go signal and a saccade is triggered 15 ms (efferent delay) after threshold is crossed. Initial build-up rates are drawn randomly in each trial. Gray shades indicate the time during which the Cue information is available to modulate the motor activity. d, e, Two trials (guesses) with Gap = 250 ms and negative rPTs. f–h, Three trials (informed choices) with Gap = 100 ms and positive rPTs.

