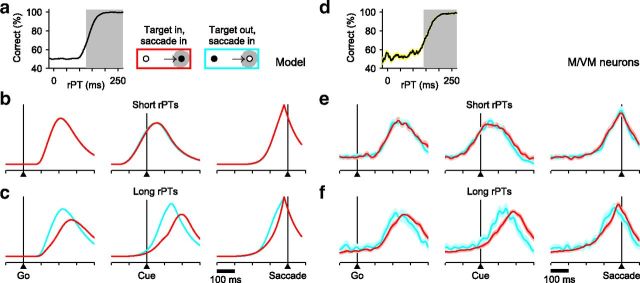
Figure 5.
Correct versus incorrect responses as predicted by the model and as observed in FEF motor-related activity. Model results are from the same simulation runs used in Figure 4. a, Tachometric curve obtained from simulated trials. Two rPT ranges were used to parse the data: short (white region; guesses) and long (gray shade; informed choices). b, c, Average model responses for correct (red) and incorrect (cyan) responses in the preferred direction of the model neurons. d–f, As in a–c, but for 45 FEF neurons (26 M, 19 VM) that differentiated significantly between movements into and away from the RF before the saccade (same cells as in Fig. 4). Shaded areas indicate ±1 SE across neurons. In all plots, the y-axis corresponds to normalized firing rate.

