
Figure 9.
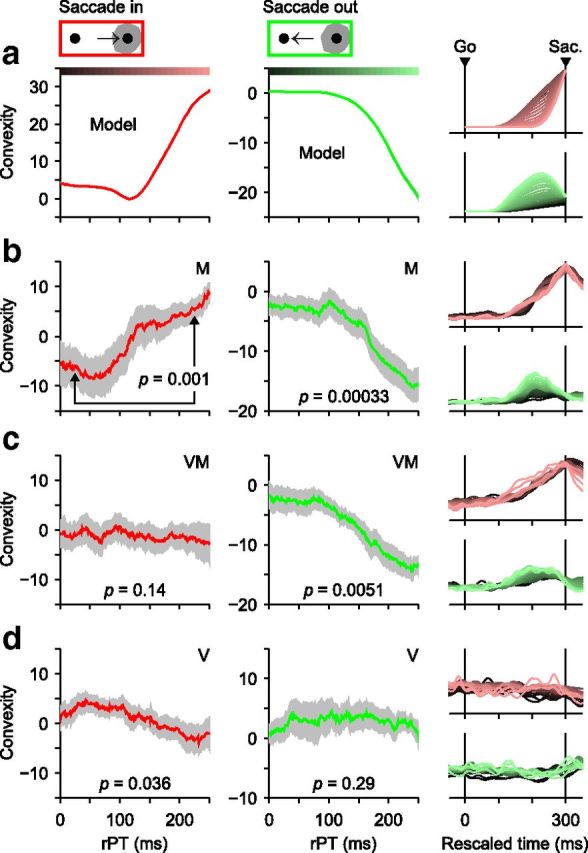
Perceptual modulation, quantified by convexity, varies across neuronal types. a, Convexity as a function of rPT as predicted by the accelerated race-to-threshold model. Simulated trials were aligned on saccade onset, temporally rescaled (i.e., RT-equalized), and grouped according to rPT (bin width = 80 ms). Separate firing rate traces, averaged across trials, were generated for responses into the RF (right column, top) and away from the RF (right column, bottom). The convexity of those traces was then calculated and plotted as a function of rPT for inward (red curve, left column) and outward responses (green curve, middle column). Color bars indicate rPT bins for example traces on the rightmost column. Positive, negative, and zero convexities correspond to trajectories that curve upward, downward, or are straight, respectively. b, As in a, but for 26 spatially selective M neurons. Gray shades indicate SEs obtained by bootstrapping. Significance values shown (p, from permutation test) are for the difference in convexity across the two rPT bins indicated (rPT = 25 and 225 ms). c, As in b, but for 19 spatially selective VM neurons. d, As in b, but for 18 V neurons.