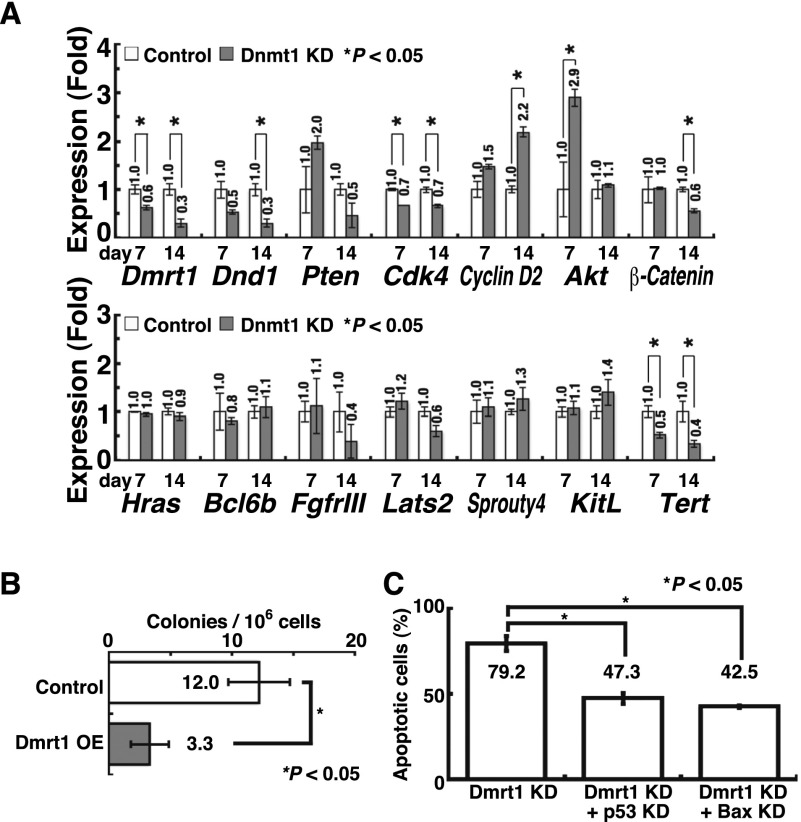
Figure 2.
Development of mGS cells after Dmrt1 knockdown (KD). (A) Real-time PCR analysis of GCT candidate gene expression in p53 knockout (KO) GS cells after Dnmt1 knockdown (n = 3). pSicoR was used as a control. (B) Suppression of mGS cell development by Dmrt1 overexpression (OE) 28 d after Dnmt1 knockdown (n = 9). CSII-EF1α-IRES2-Venus was used as a control. (C) Suppression of Dmrt1-induced apoptosis by p53 or Bax knockdown. For each cell type, at least 68 cells were counted 7 d after transfection (n = 5).

