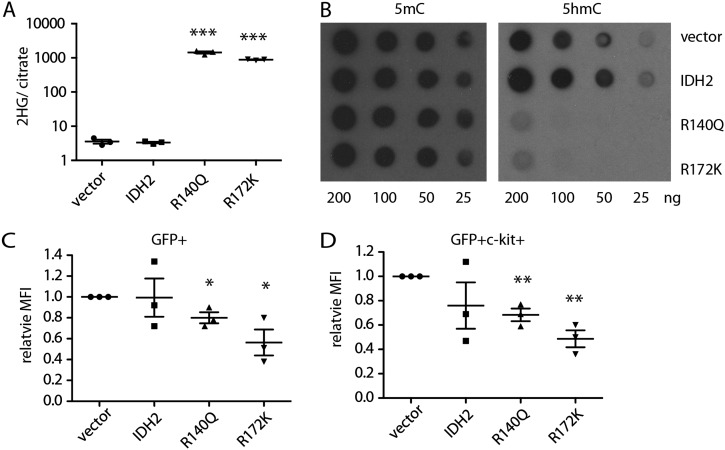
Figure 5.
IDH2 mutants lead to abnormal DNA methylation in hematopoietic cells. (A) 2-HG levels in the whole BM cells of recipient mice. n = 3. (B) Representative dot blots showing 5mC and 5hmC levels of whole BM genomic DNA. (C) Relative mean fluorescence intensity (MFI) of 5hmC in GFP+ BM cells. n = 3. (D) Relative MFI of 5mC in GFP+ c-kit+ BM cells. n = 3.

