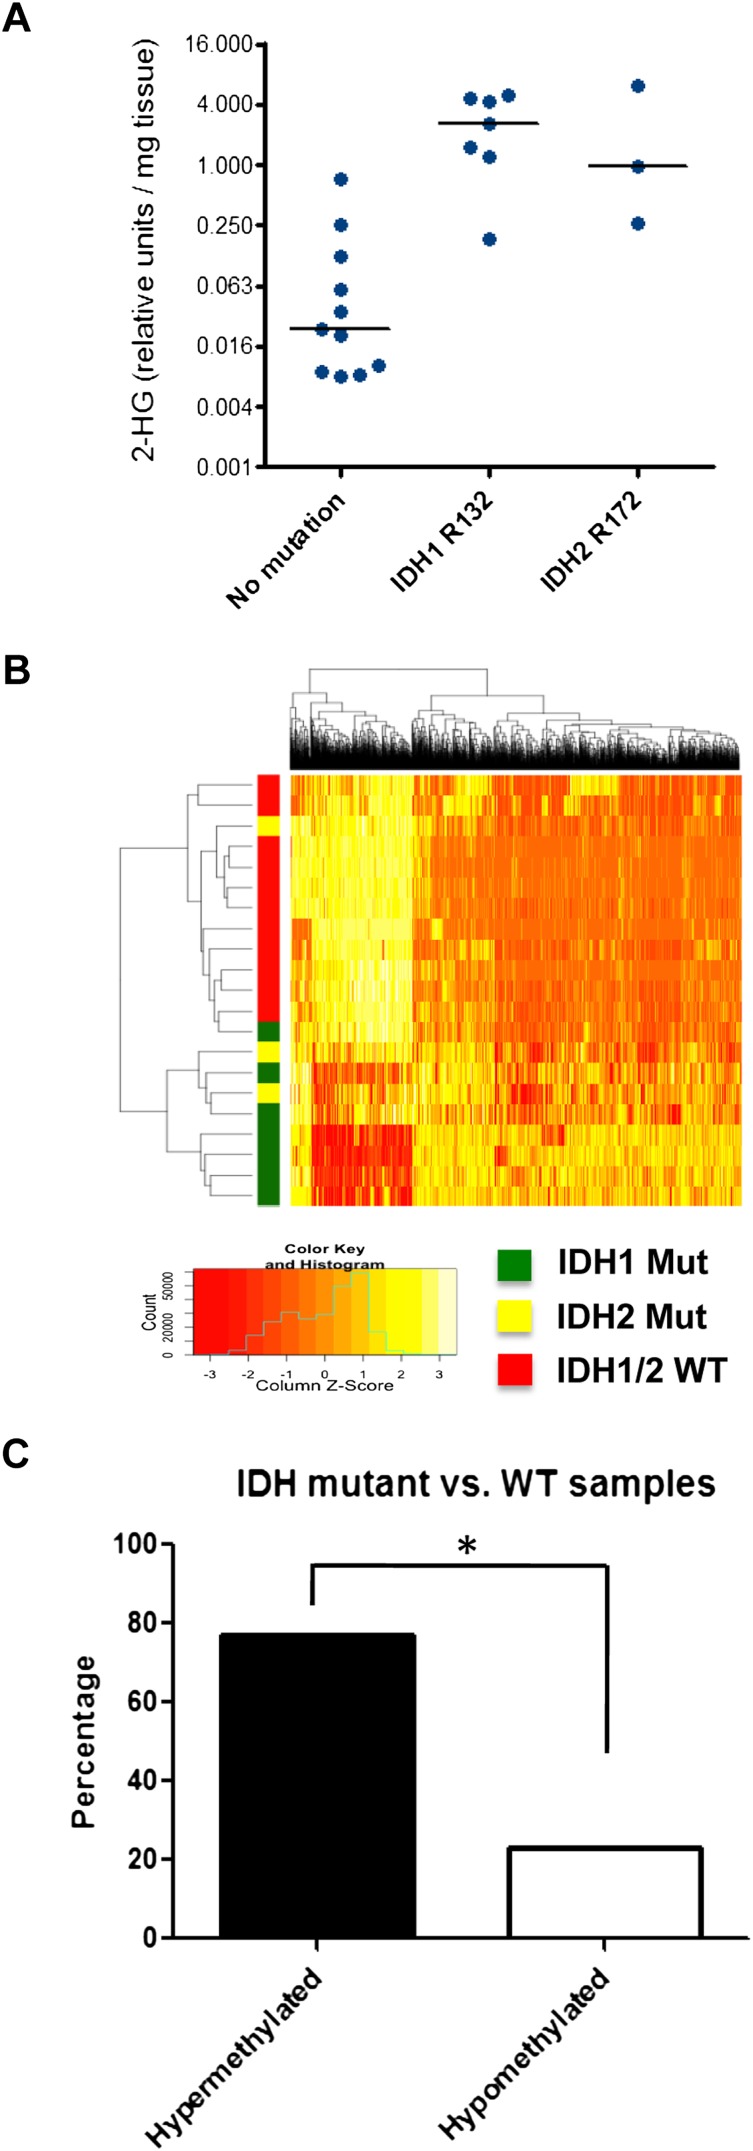
Figure 1.
ERRBS analysis of chondrosarcoma patient samples. (A) Twenty-one blinded chondrosarcoma samples were analyzed for 2HG levels by gas chromatography-mass spectrometry (GC-MS). Subsequently, samples were decoded and grouped according to IDH1/2 mutational status. (B) ERRBS was performed on genomic DNA extracted from chondrosarcoma patient samples to generate genome-wide base-pair resolution CpG methylation information. A heat map representing the hierarchical clustering of samples with wild-type (WT) or mutant IDH1/2 is shown, based on a supervised analysis for differentially methylated CpGs at CpG islands. Each row represents a sample, and each column represents a CpG. The level of methylation is represented using a color scale, as shown in the legend. (C) Bar graph showing the percentage of hypermethylated and hypomethylated CpGs comparing IDH1/2 mutant with wild-type chondrosarcoma samples. (*) P < 0.0001 by χ2 test.

