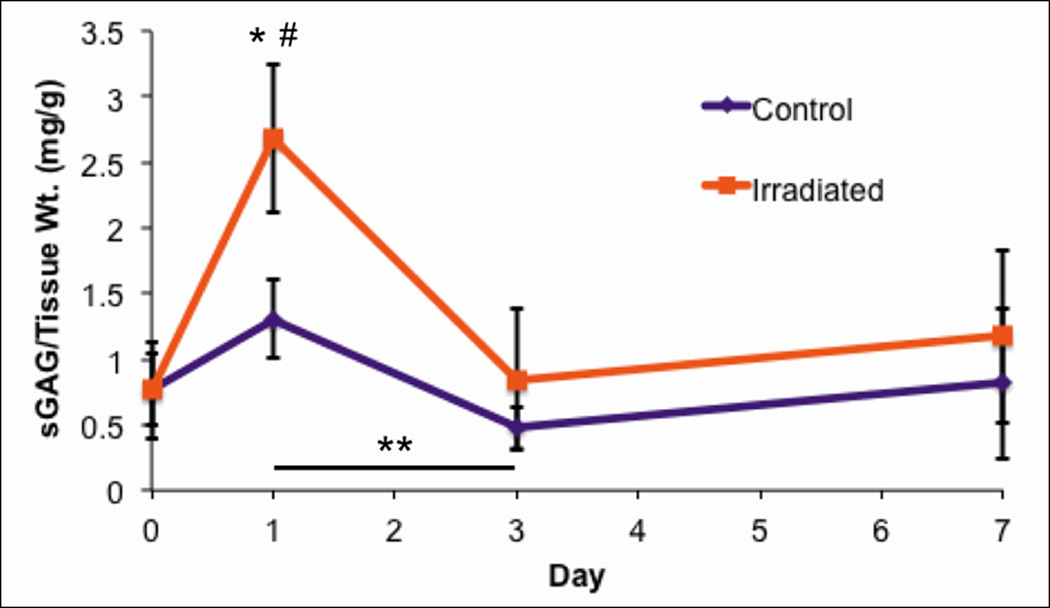
Figure 3.

Normalized sGAG content in the culture media over time (n = 6, error bars ±standard deviation). Significantly higher sGAG was released into the media in irradiated samples when compared to control samples at Day 1 (*, p < 0.001), while there was no significant difference in sGAG released between treatment groups at the Day 0, 3, or 7 time points. Concentrations of sGAG in the media of the irradiated samples were significantly higher at Day 1 when compared to Days 0, 3, and 7 (#, p < 0.001). Additionally, sGAG content in the media of the control samples was significantly greater at Day 1 when compared with Day 3 (**, p < 0.01).
