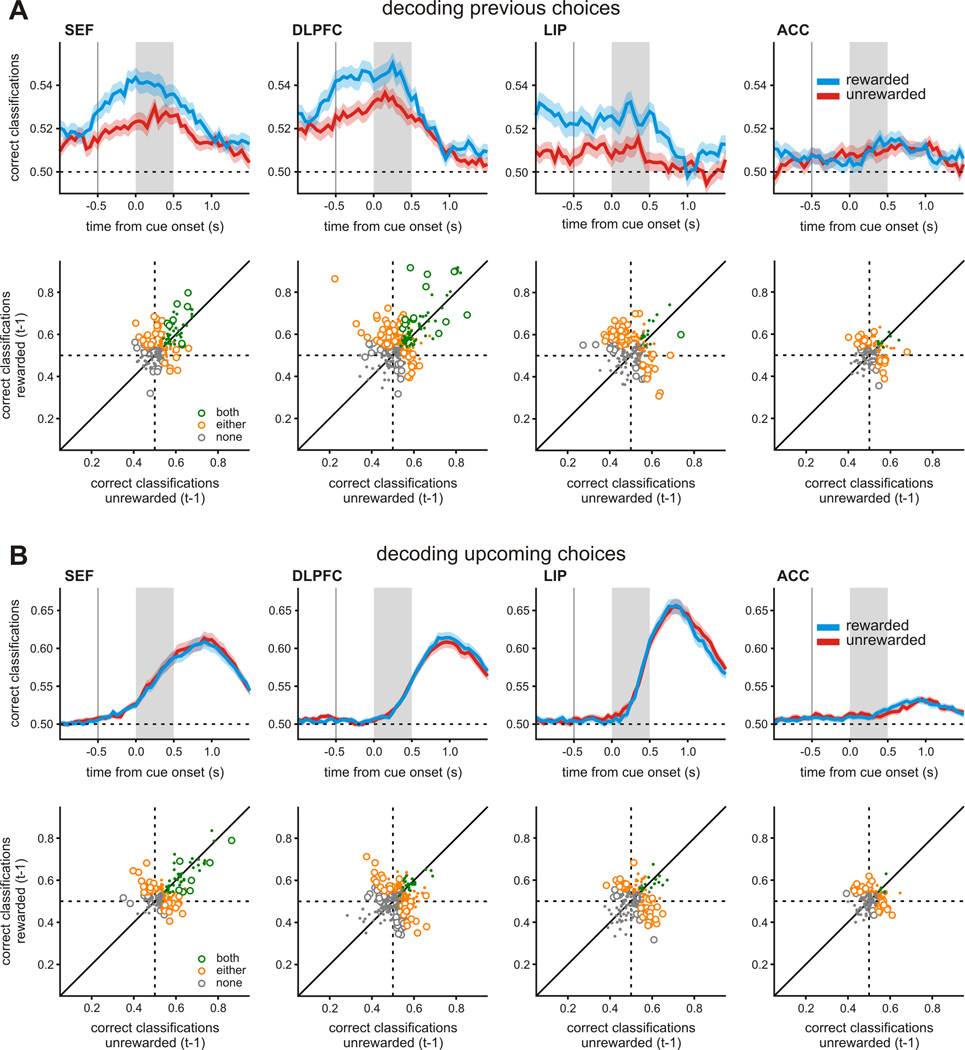
Figure 5.
Population summary for the effect of reward on the neural encoding of previous choice during the matching pennies task. A. Top. Average decoding accuracy for the previous choice estimated using a sliding window separately according to whether the animal’s previous choice was rewarded or not. The shaded area indicates mean ± SEM. Bottom. Scatter plots show classification accuracy for each neuron following rewarded versus unrewarded trials. Symbol colors indicate whether the decoding accuracy was significantly above chance for both (green), either (orange), or neither (grey) of rewarded and unrewarded outcomes (z-test, p<0.05). Open and closed symbols indicate whether classification was significantly different for the two outcomes. B. The decoding accuracy for the animal’s upcoming, shown in the same format as in A. See also Figures S2 and S3.

