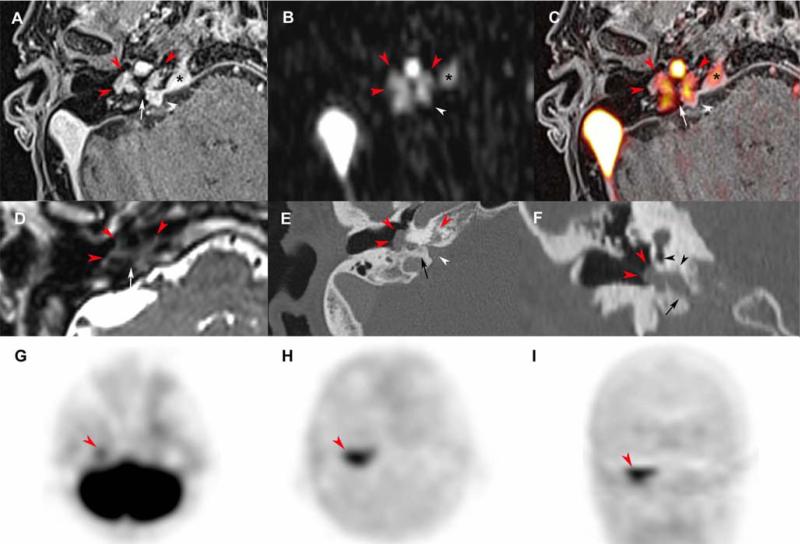
Figure 2. Tympanic paraganglioma extending into the petrous apex.
Axial 3D volumetric interpolated fat-saturated (FATSAT) T1-weighted (VIBE) (A), early arterial 4D Dynamic MR Angiography (MRA) (B), FATSAT T1-weighted/4D-MRA 3D fusion image (C), T2-weighted 3D imaging with different flip angle evolutions (D), CT reconstruction with a bone algorithm in the axial plane (E) and coronal oblique plane (F), axial 18F-FDG PET (G), axial and coronal 18F-FDOPA PET (H,I).
Tympanic PGL (red arrowheads) spreading along Jacobson's nerve canal (A, C-F, white arrows) deeply into the petrous apex along the cochlear aqueduct (white arrowheads, A-C, E). The CT shows integrity of the promontory and round window (F, black arrowheads) before surgical procedure. Note the early enhancement of the superior petrosal sinus suggesting tumor invasion (A-C, asterisk). 18F-FDOPA PET shows a highly avid tympanic PGL with extension in the anteromedial plane. The tumour was barely visible on 18F-FDG PET.

