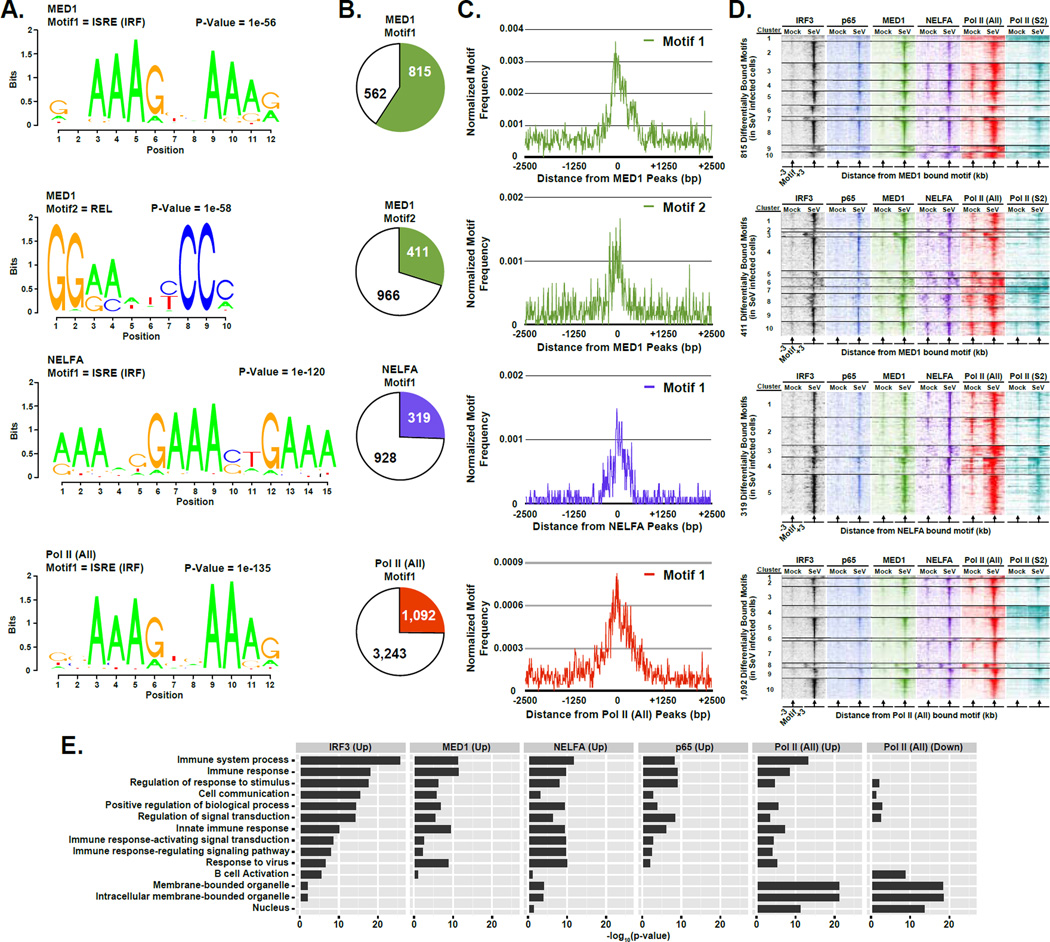
Figure 6. IRF3 acts as a master regulator of innate immunity activated transcriptional networks.
(A) Graphical representations of the most frequent DNA sequence motifs identified by HOMER within the 1,377 MED1-, 1,247 NELFA-, or 4,335 Pol II (All)-bound regions with ≥ 2-fold occupancy increase following virus infection (p-value < 1 × 10⁻⁵). Each DNA logo represents the information content/bp by height, with p-value indicating statistical significance for the motif enrichment. P-values and the representative motif name found in the databases (JASPAR, Transfac, HOMER) are displayed above their corresponding motif.
(B) Pie charts representing the genomic DNA sequences of the bound regions described in (A) (± 100 bp from each peak center) scanned for matches to each of the motifs. Pie charts representing the distribution of motifs present in differentially bound MED1, NELFA, or Pol II (All) peaks. Colored sections indicate the fraction of bound MED1, NELFA, or Pol II (All) genomic sites that contain at least one match to the indicated DNA sequence motif. The number of regions in which a match is present or absent is indicated.
(C) Plot of the mean motif density at bound regions described in (A) within 2.5 kb of the peak center. Motif density signals are grouped into 10 bp bins.
(D) Heatmap representation of IRF3 (black), p65/RELA (blue), MED1 (green), NELFA (purple), Pol II (All; red), and Pol II (S2P; teal) occupancy levels at the differentially occupied loci defined in (A) that encompasses the identified motif. Data are organized to illustrate 3 kb surrounding the motif center. Occupancy levels are rank ordered from most to least occupied according to the indicated factor and divided into 5 or 10 sections by k-means clustering analysis
(E) Enrichment of gene ontology (GO) categories among genes nearest IRF3, p65/RELA, MED1, NELFA, or Pol II (All) bound regions demonstrating ≥ 4-fold increase or decease (as noted) in occupancy following Sendai virus infection (p-value < 1 × 10⁻⁵). Representative GO categories are shown; the complete set of enriched GO categories is listed in Supplemental Table 5.

