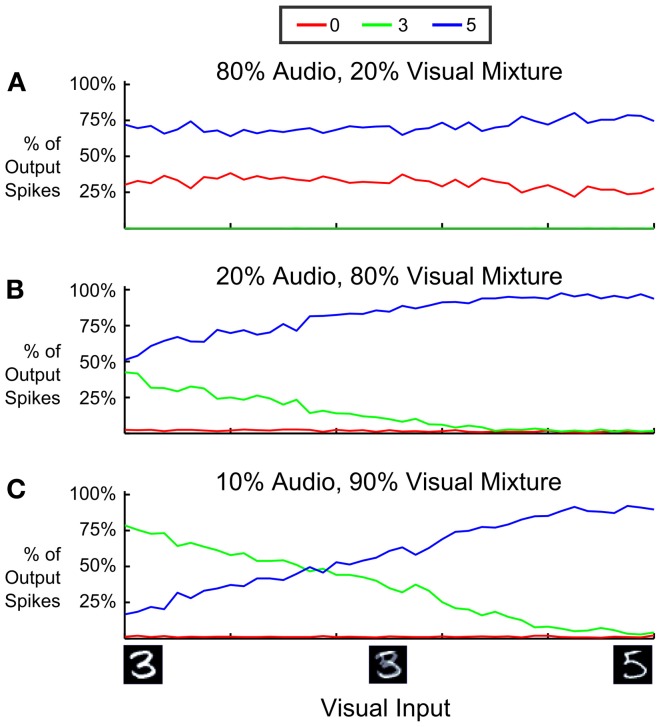
Figure 10.
Proportion of output spikes for 3 different mixture ratios of auditory and visual input in a multi-sensory spiking DBN. Red, green, and blue encode the ratio of 0, 3, and 5 choices (spikes) relative to the total number of spikes emitted from the Label Layer (averaged over 10 trials). The horizontal axis sweeps the probability that visual input spikes are chosen from either a “3” digit or an aligned “5” digit. Auditory input consists of a mixture of “0” and “5” inputs, with four times more spikes indicating a “0”. Over a wide range of mixture values, the network correctly infers the only consistent interpretation of the multi-modal input, which is class “5”. Inputs that are inconsistent with the dominating sensory domain (“3” in A, “0” in B,C) are mostly suppressed.

