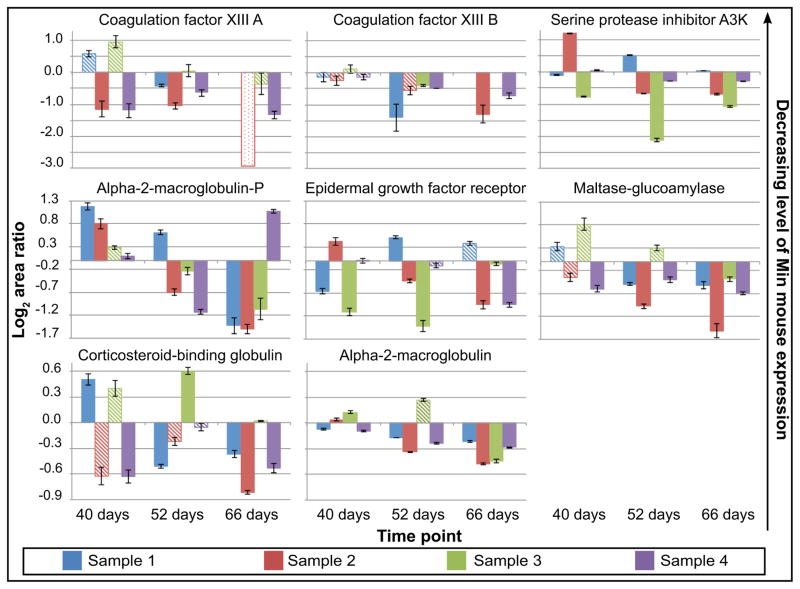
Figure 4.
Downregulated proteins in the 14N/15N Min mouse displaying high statistical confidence at 52 and/or 66 days in at least three out of four mouse samples. Solid bars on the bar chart represent the geometric mean of the log2 area ratios (all ratios are shown as Min/WT) that are statistically significant. Significance was defined as a U-value less than 0.05 and corresponding q-values less than 0.05. Hashed bars represent area ratios that do not pass statistical cutoffs for significance. Outlined bars with light dots represent values where there is no statistical data due to the presence of only one data point.

