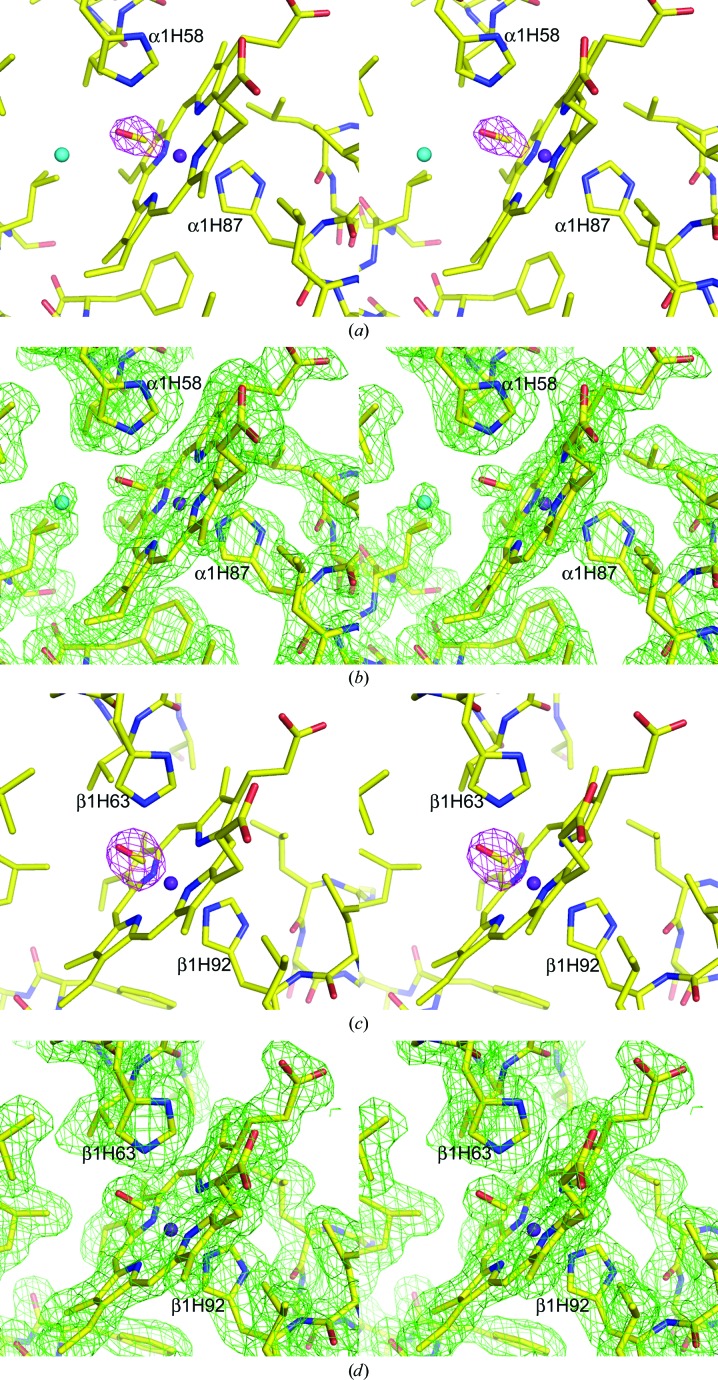
Figure 1.
Stereoviews of the electron-density map and the final model of the Hb ζ2β2 s ABCD heme environment. (a) Composite F o − F c OMIT map of the bound CO ligand at the ζ1 heme contoured at 5σ. (b) Final 2F o − F c map of the ζ1 heme and surrounding residues contoured at 1.2σ. (c) Composite F o − F c OMIT map of the bound CO ligand at the βs1 heme contoured at 5σ. (d) Final 2F o − F c map of the βs1 heme and surrounding residues contoured at 1.2σ.

