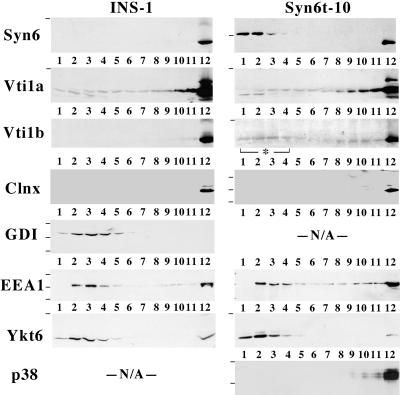
Figure 10.
Syn6t expression alters the distribution of Vti1b in INS cells. Control INS cells or Syn6t-10 cells were treated with ponasterone for 24 h, lysed, and the cell extracts loaded on sucrose velocity gradients. The numbered fractions run from top to bottom of the sucrose gradients. Each fraction was analyzed by SDS-PAGE and immunoblotting with the antibodies indicated. Small horizontal lines to the left of the gels indicate positions of prestained molecular mass markers that allowed for identification of the correct region. Clnx, calnexin; EEA1, early endosomal antigen 1; p38, synaptophysin.

