Figure 4.
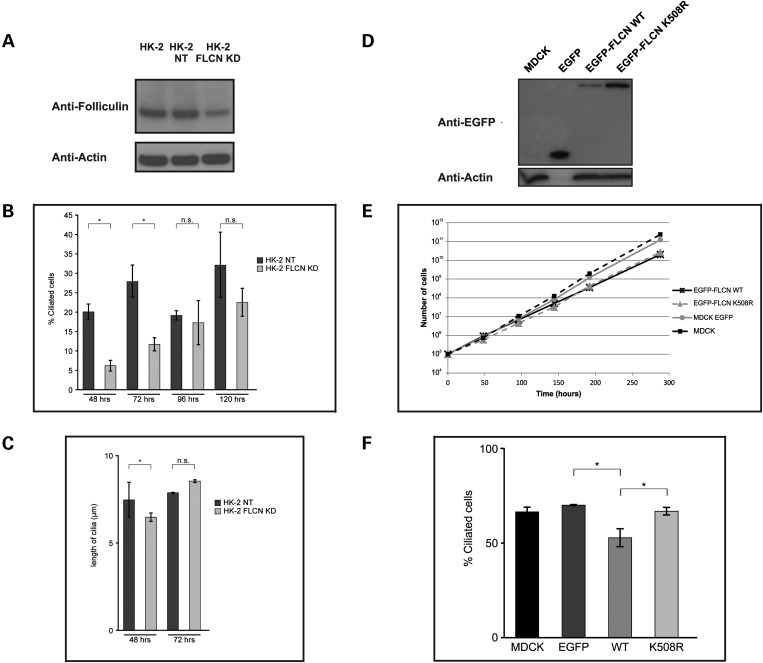
Knockdown and exogenous expression of FLCN affects ciliogenesis in kidney cells. (A) Western blot of knockdown and control cells. Western blot on 30 µg of WCL showing stable knockdown of FLCN using shRNA in HK-2 clone FLCN KD compared with wild-type HK-2 and HK-2 with scrambled control shRNA clone NT (also see Supplementary Material, Fig. S6). Membrane was probed with FLCN AP antibody. Actin was used as a loading control. (B) Measurement of ciliogenesis in FLCN knockdown versus non target control. HK-2 FLCN KD and NT cells were serum starved for the indicated amount of hours, fixed and stained with acetylated alpha tubulin to mark the ciliary axoneme and pericentrin to mark the ciliary base. Nuclei were stained with DAPI and the percentage of ciliated cells and cilium length was measured using ImageJ. After 48 h (P < 0.001) and 72 h (P < 0.001) of serum starvation, HK-2 FLCN KD cells showed a statistically significant reduction in the percentage of ciliated cells compared with NT cells. After 96 h (P = 0.915) and 120 h (P = 0.067) of serum starvation, there was no difference in the percentage of ciliated cells between the two cell lines. Error bars represent standard error of the mean. Average of 350 cells counted per cell line per time point. *P < 0.05. (C) Measurement of cilia length in FLCN knockdown versus non-target control. Average cilium length of HK-2 FLCN KD cells (n = 40) was significantly decreased compared with cilia of NT cells (n = 124) after 48 h of serum starvation (P = 0.001). After 72 h of serum starvation, no difference in cilia length was observed between HK-2 FLCN KD (n = 24) and NT cells (n = 55) (P = 0.55). Error bars represent standard error of the mean. *P < 0.05. (D) Western blot of FLCN expressing cell lines. Western blot probed with EGFP antibody showing MDCK cells with stable expression of EGFP alone, EGFP-FLCN WT and the disease-causing FLCN missense variant EGFP-FLCN K508R. Actin was used as a loading control. Actin is not detected in the EGFP-only MDCK cells, as a result of 10-fold dilution of this sample due to very high EGFP expression in this cell line. (E) Growth curve in FLCN expressing cell lines. At a starting density of 105 cells per well, untransfected MDCK cells and MDCK cells with stable expression of EGFP, EGFP-FLCN WT or EGFP-FLCN K508R were plated. Cell number was determined at each time point. Each data point is the average of six independent counts. Error bars represent standard error of the mean. (F) Measurement of ciliogenesis in FLCN expressing cell lines. Untransfected MDCK (MDCK) and MDCK cells stably expression EGFP, EGFP-FLCN WT (WT) or EGFP-FLCN K508R (K508R) were maintained at confluence for 5 days, fixed and stained with acetylated alpha tubulin to mark the ciliary axoneme and with DAPI to stain nuclei. Cells expressing EGFP-FLCN WT showed a statistically significant reduction in the percentage of ciliated cells compared with cells expressing EGFP alone (P < 0.001) or EGFP-FLCN K508R (P < 0.001), as counted using ImageJ. Error bars represent standard error of the mean. *P < 0.05.

