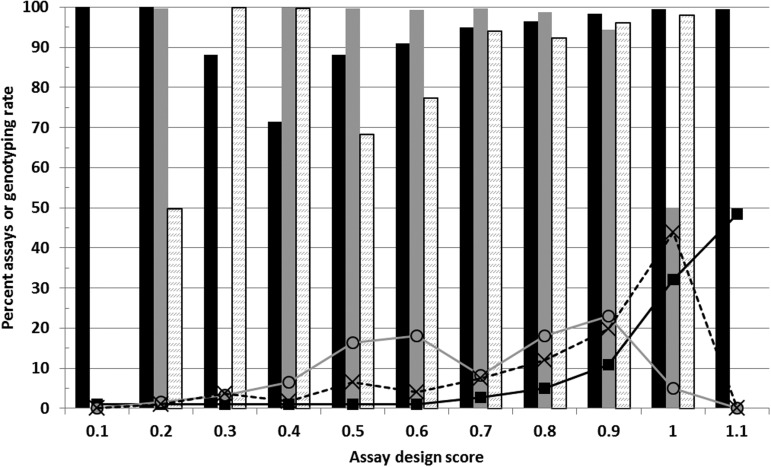
Figure 1.
Distribution of assay conversion rates for SNPs in various design categories. Assays were assigned to Infinium design score bins equal to or less than the indicated values. The percent of all assays in a bin that successfully generated genotypes (unambiguous SNP allele calls in at least 95% of DNA samples) is plotted for Infinium-eligible SNPs in the Illumina database (black bars), mitochondrial DNA SNPs (gray bars), and SNPs uploaded as custom sequences (dashed bars). The number of SNPs in each bin, as a percent of total SNPs in each category, is plotted with square line markers for Infinium database SNPs, circles for mitochondrial, and X for custom sequences.

