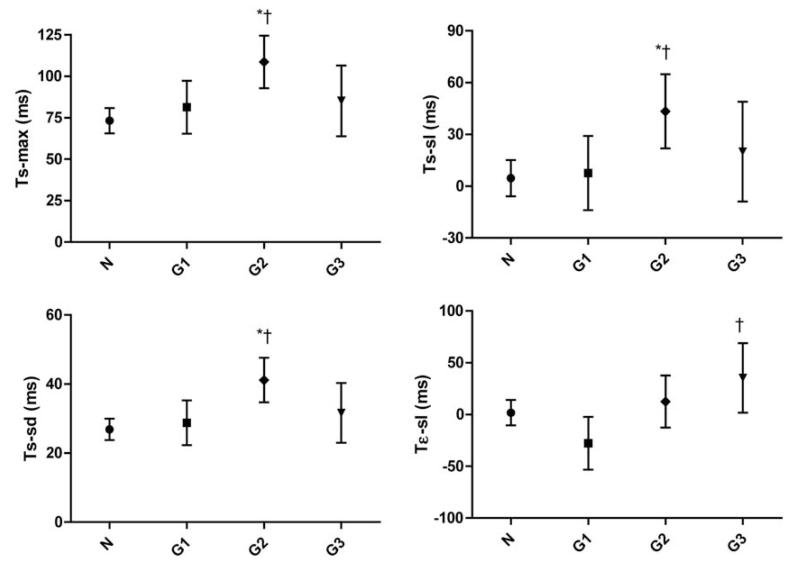
Figure 3.
Adjusted LV mechanical delay indexes by diastolic function groups. N, normal diastolic function, n = 136; G1, Group 1 (impaired relaxation), n = 24; G2, Group 2 (elevated end-diastolic pressure), n = 26; G3, Group 3 (combined dysfunction), n = 14. Significance between groups: *P < 0.05 between normal function and diastolic dysfunction groups; †P < 0.05 between diastolic dysfunction Group 1 and other diastolic function groups; LV, left ventricle. Abbreviations are listed in Table 2.

