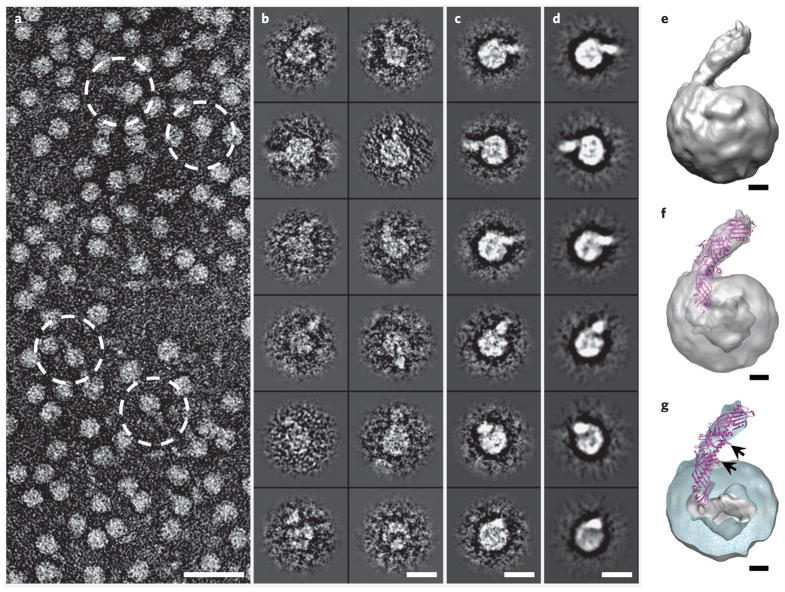
Figure 3. Three-dimensional reconstruction of HDL–CETP complex by OpNS-EM.
(a) Survey view of the negative-stained EM structure of HDL–CETP complexes (dashed circles). (b–d) Twelve representative views of selected and windowed individual raw particles of HDL–CETP complexes (b) and their corresponding class averages (c) are compared with the same views of the reconstructed projections (d). (e) The three-dimensional density map (~14-Å resolution, reconstructed from 6,607 homogenous particle images) shows a binary complex in which the banana-shaped CETP is attached to the HDL surface at a ~45° angle. (f,g) Inserting the CETP crystal structure into the EM density map of an HDL–CETP complex shows the N-terminal β-barrel domain of CETP penetrating the outer shell of HDL and its distal end in the low-density core in transparency (f) and cut-away surface view (g). The cut-away surface view (cyan) in g shows the HDL portion containing a high-density outer shell (~18–27 Å thick) and a low-density cavity (~55 Å in diameter). The black arrows in g point to two phospholipid-binding pores, one of which is adjacent (~15 Å) to the HDL surface, whereas the other is further away, indicating that the phospholipid-binding pores of CETP do not interact directly with the HDL core. Scale bars: a, 300 Å; b–d, 100 Å; e–g, 20 Å.

