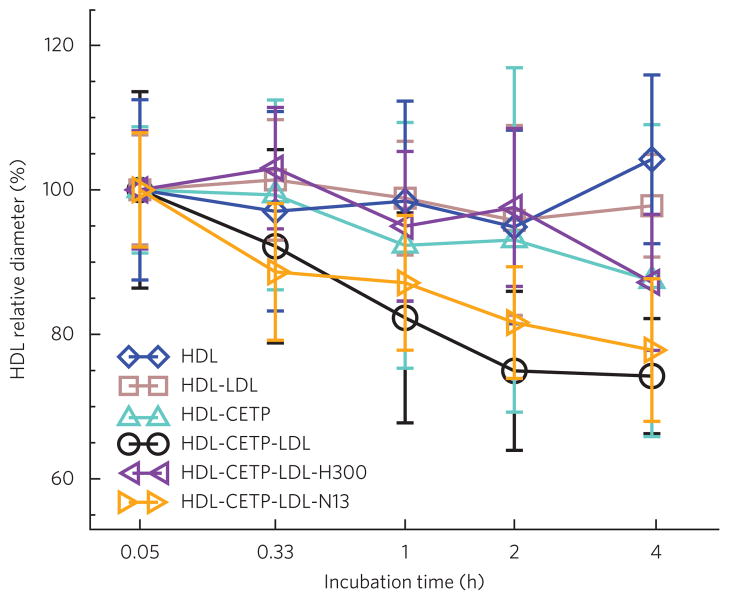
Figure 5. Analysis of HDL size change during incubation with CETP.
Samples were collected and viewed by OpNS-EM. A total of ~500 HDL particles for each incubation condition were selected from EM micrographs for quantitative size analysis. The geometric sizes of particles were calculated (Supplementary Methods) and expressed as the mean ± s.d. Quantifying the size of HDL particles for HDL alone (blue) and for HDL-LDL (brown) and HDL-CETP (cyan) mixtures shows no substantial size changes during the incubation time except for in the ternary HDL-CETP-LDL mixture (black). The diameters of HDL particles following incubations with LDL and CETP in the presence of antibodies H300 (purple) and N13 (gold) are also shown.

