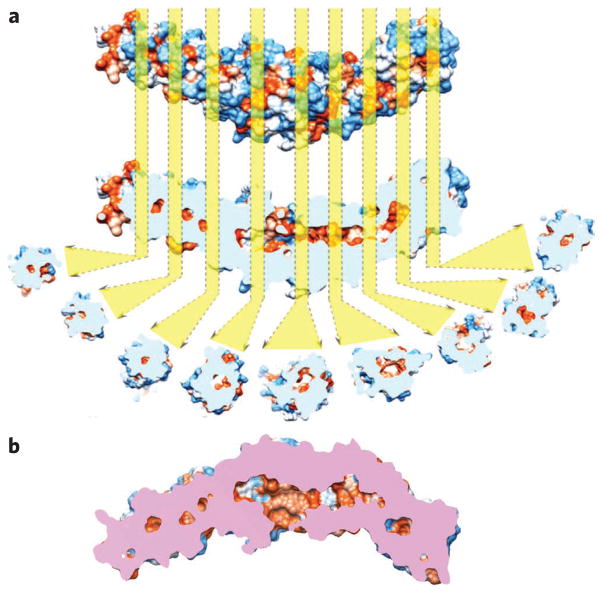
Figure 6. Analyses of the crystal structure of CETP.
(a) The CETP crystal structure is shown according to its van der Waals surface and is colored by its hydrophobicity (ranging from royal blue for the most hydrophilic to orange-red for the most hydrophobic). Longitudinal cut-away cross-sections show hydrophobic cavities (orange) from the center of the N-terminal β-barrel domain to the center of the C-terminal β-barrel domain. The distal portions of both β-barrels of CETP appear to be sealed. The cavities were aligned along the center of each domain, potentially reflecting the cholesteryl ester transfer pathway. The longest dimension of the pathway is about ~105 Å. (b) The cut-away surface view of CETP. The side openings near the center of the molecule are the phospholipid-binding pores. Pink regions show the cross surface between the cutting plane and the CETP molecule.

