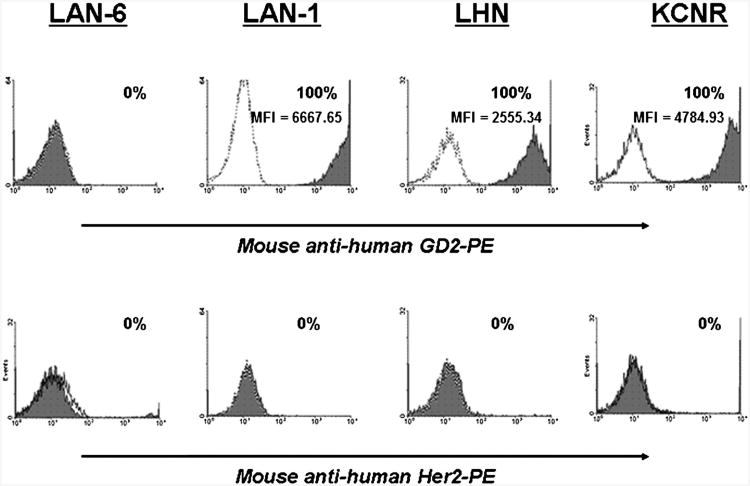
Fig. 2.
GD2 and Her2 expression in neuroblastoma cell lines. The tumor cells were examined for expression of GD2 and Her2 proteins by flow cytometry, using anti-GD2 and anti-c-erbB2 mAb. Data are presented as histograms with their matched IgG isotype antibodies (open dotted curves) to account for background fluorescence. Solid gray histograms represent cells that are positive for GD2. Percentage of positive cells is shown as well.

