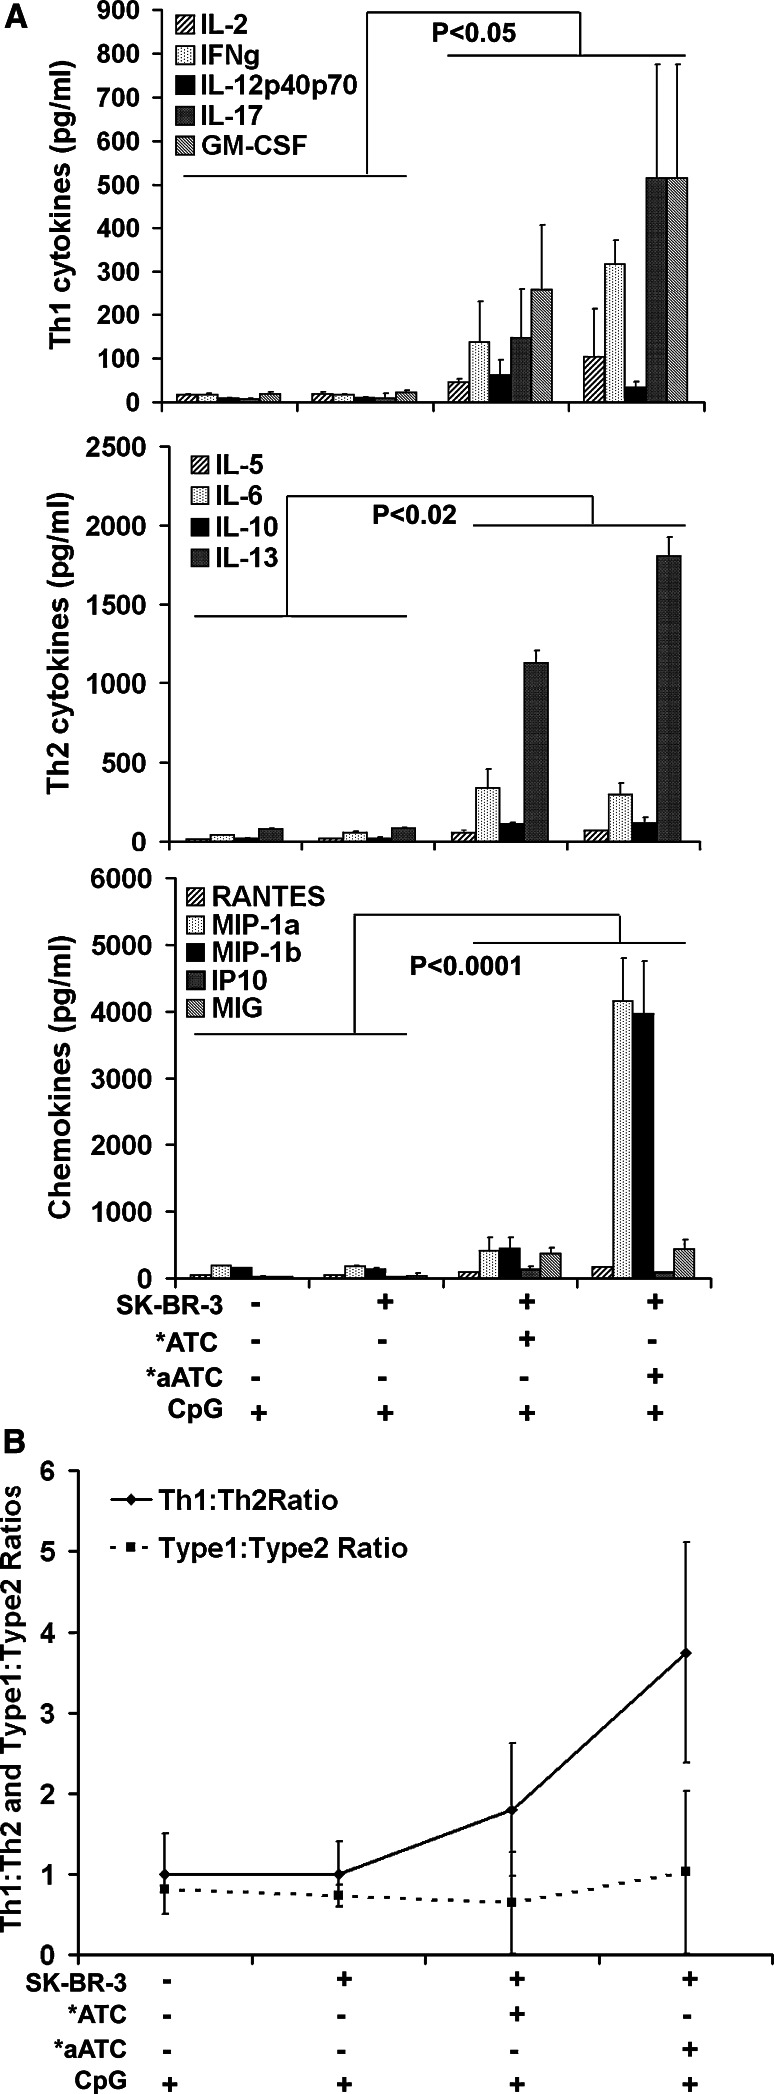
Fig. 4.
Cytokine profile of co-cultures of PBMC, briefly exposed to SK-BR-3 cells, and autologous *ATC or *aATC in the presence of CpG. The cytokine array represents results of two independent experiments. a Top panel show Th1 cytokines IL-2, IFN-γ, IL-12p40p70, IL-17, and GM-CSF. Middle panel, show Th2 cytokines IL-5, IL-6, IL-10, and IL-13. Bottom panel shows chemokines RANTES, MIP-1α, MIP1β, IP-10, and MIG at day 14. b shows the Th1:Th2 ratio and Type 1:Type 2 ratio at day 14 from the indicated culture conditions

