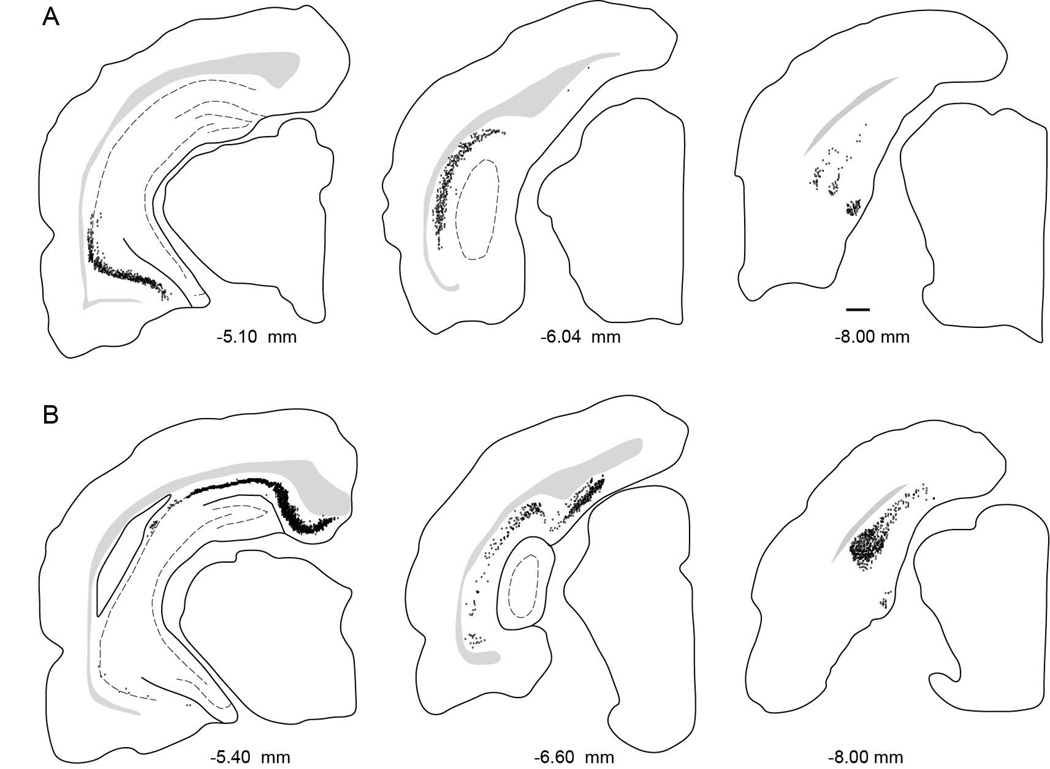
Figure 7.
Distribution of labeled cells arising from injection sites located in the LEA and MEA. Computer generated plots showing the distribution of retrogradely-labeled cells in the hippocampal and parahippocampal areas, following tracer injections. A. Computer-generated plots showing the distribution retrogradely-labeled cells in hippocampal structures arising from an LEA injection site (Case 124FB, −5.4 mm relative to β). B. L Computer-generated plots showing the distribution retrogradely-labeled cells in hippocampal structures arising from an MEA injection site (Case 113DY, −7.6 mm relative to β).

