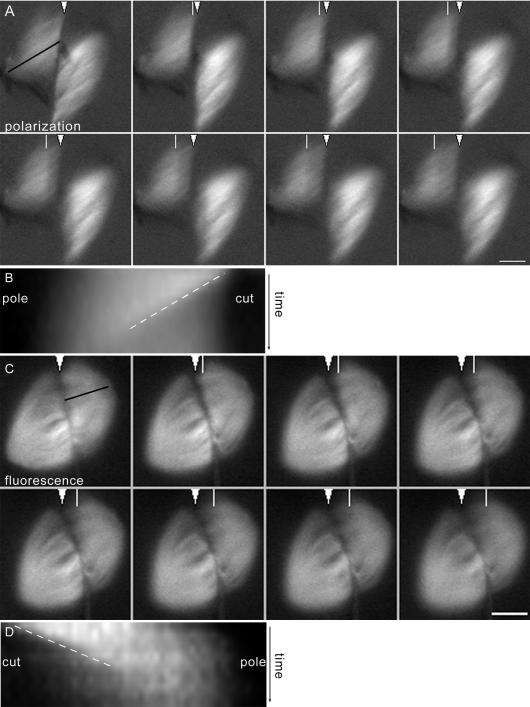
Figure 3.
Spindle microtubules depolymerize rapidly after cutting. (A) Frames from a time-lapse image of a cut spindle imaged by polarization microscopy. In the first frame, the cut is marked with a white arrowhead, and the line used for making the kymograph is shown with a black line along the fibers. In subsequent frames, a white line shows the position of the depolymerization front. See Supplemental Movie 3A. (B) Kymograph of the spindle in A showing the depolymerization front as it moves from the cut edge toward the associated spindle pole. The slope of the line of the kymograph (white dashed line, position vs. time) was used to calculate depolymerization rates. (C) Frames from a time-lapse image of a cut spindle imaged by fluorescence microscopy, labeled as in A. See Supplemental Movie 3C. (D) Kymograph of the spindle in C showing the depolymerization front, labeled as above. Bar, 10 μm.

