
Fig 5.
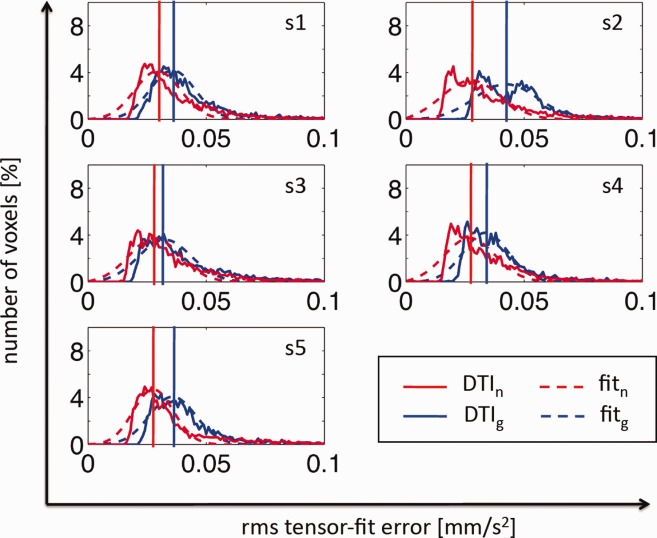
Comparison of the tensor-fit error between gated and nongated DTI data for five subjects (s1–s5). To this end, the histogram of the adjusted rms of the tensor-fit error (adjusted for effective degrees of freedoms) is shown for the gated (blue solid line) and nongated (red solid line) data using the standard tensor model (i). The histogram of the adjusted rms-tensor-fit error was fitted by a Rician distribution function (dashed lines) and the mode of the distribution was identified (vertical lines). Unexpectedly, the tensor-fit error (i.e., the mode of the histogram of the adjusted rms-tensor-fit error) was always smaller for the nongated than for gated data.