
Fig 10.
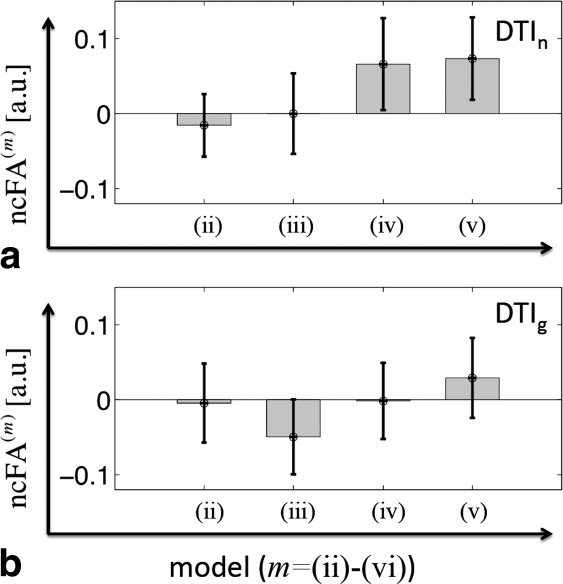
Comparison of FA difference maps obtained from either of the extended tensor models (ii)–(v) with the FA difference obtained from the robust fitting model (vi). For this purpose, the normalized cross-correlation (ncFA(m), Eq. [12]) between ΔFA(vi) and ΔFA(m) [m = (ii)–(v)] was calculated for the DTIn (top row) and DTIg (bottom row) data within the brainstem ROI shown in Figure 1. A slight correlation between the extended tensor model and robust fitting was observed for the nongated data when the extended tensor models with nonlinear regressors [(iv) and (v)] were used. Correlations were not observed for the gated data.