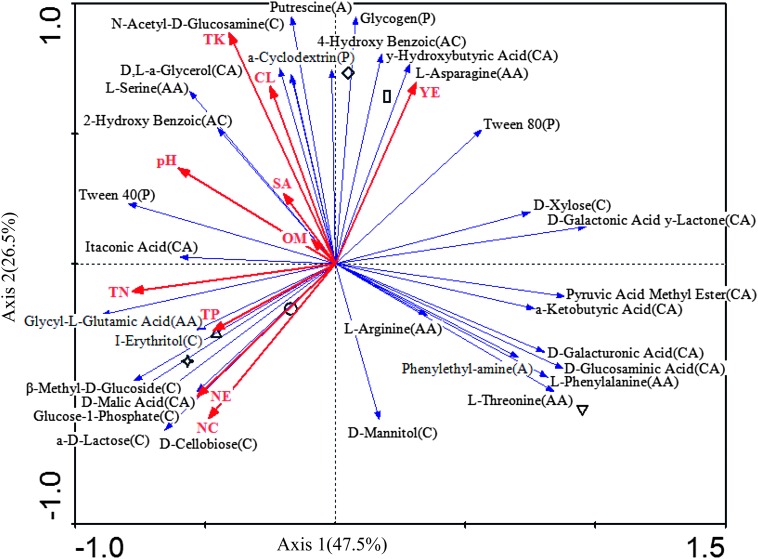
Fig. 2.
Redundancy analysis (RDA) of metabolic profiles for cyst samples used 31 carbon sources as species and environmental variables in 2010. Blue lines with arrows indicate the types of specific C sources (for capital letters in parentheses: C, carbohydrates; P, polymers; CA, carboxylic acids; AC, aromatic compounds; AA, amino acids and A, amines; the longer the line, the stronger the effect). Red lines with arrows indicate environmental variables: YE, years of soybean monoculture; OM, organic matter; SA, sand; CL, clay; TN, total nitrogen; TP; total P; TK, total K; pH, soil pH; NC, nematode cysts; NE, nematode eggs. Symbols indicate cysts from different years of continuous cropping (▵ 2 yr, ☆ 4 yr, ○ 5 yr, ▽ 8 yr, ◊ 12 yr, □ 40 yr).

