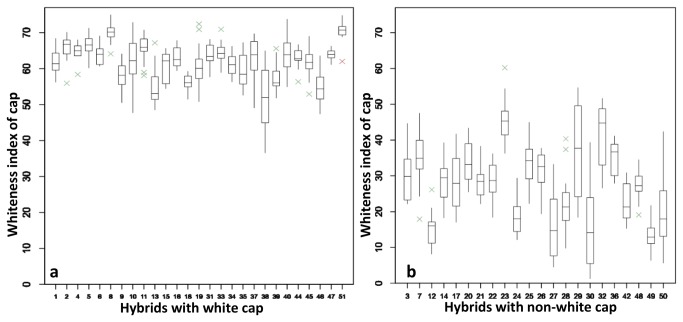
Figure 8. a. Boxplots describing variation in cap whiteness for each hybrid classified as white (flush 1).
he box spans the interquartile range of the values of cap whiteness of each hybrid, so that the middle 50% of the data lie within the box, with a line indicating the median. Whiskers extend beyond the ends of the box as far as the minimum and maximum values. The crosses indicate outliers. The cap whiteness of these hybrids were measured based on 20 individual mushrooms of flush 1 per hybrid. Long boxes indicate large variation of cap whiteness, and short boxes indicate small variation of cap color. By comparing Figure 8a and Figure 8b individual mushrooms of non-white hybrids show larger difference of cap color than that of white hybrids. b. Boxplots describing variation in cap whiteness for each hybrid classified as non-white (flush 1).

