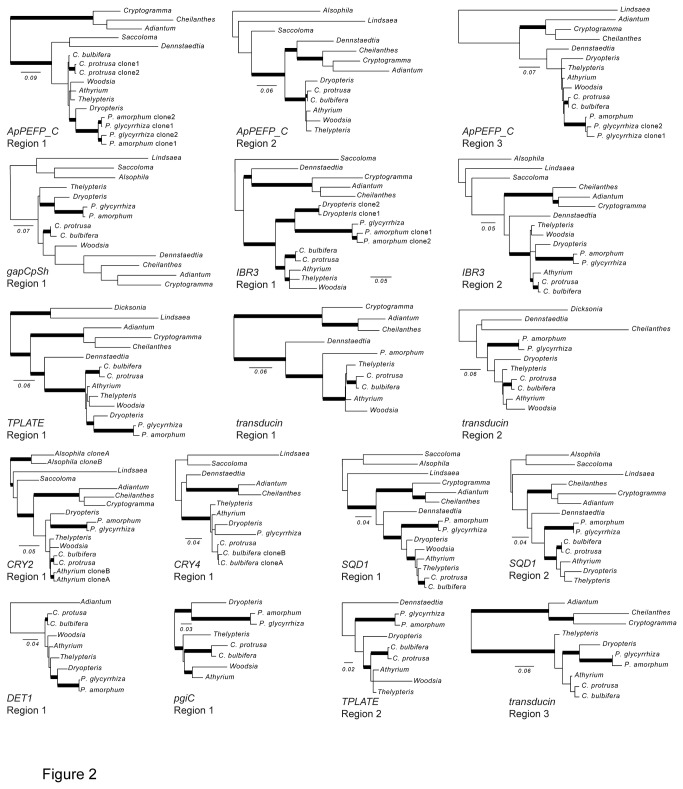
Figure 2. Maximum likelihood phylograms for each region, including only those taxa that were successfully sequenced from our 15-taxon genomic DNA test set.
Bold branches indicate strong support (≥70% bootstrap support). Scale bars are in units of substitutions per site. In the taxon names, “C.” and “P.” refer to Cystopteris and Polypodium, respectively. These phylograms are unrooted, but oriented as if rooted by the Cyatheales (or our best guess, when the Cyatheales accession did not sequence successfully), when space permits.

