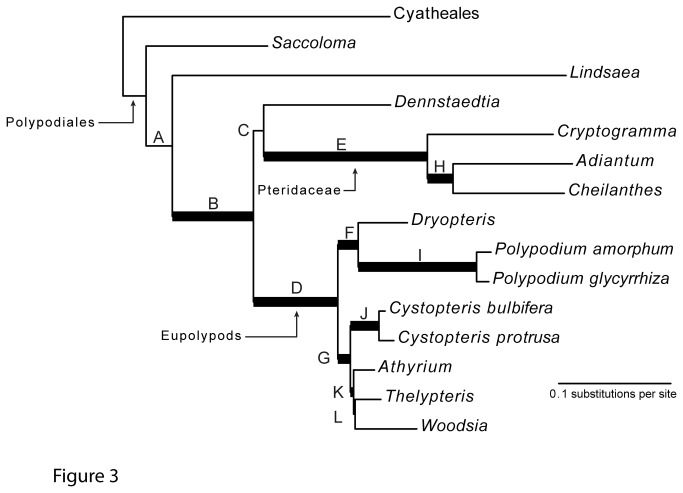
Figure 3. Combined data maximum likelihood phylogram of our 15-taxon genomic DNA test set.
Analyses were performed under our best-fitting model (model 3, see Table 3). Bold branches indicate strong support (≥70% bootstrap support); internal branches are labeled A – L for ease of discussion.

