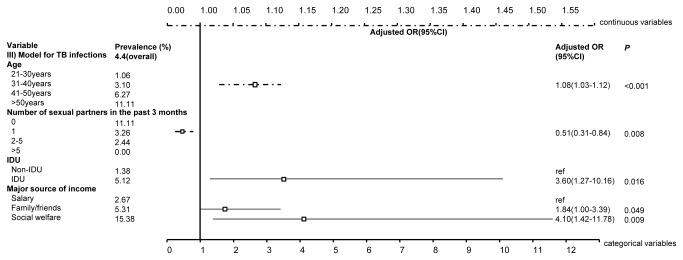
Figure 3. Significant associated factors for TB infections among MMT entrants by multivariate regression analysis.

The figure demonstrates the adjusted odds ratios (together with 95% confidence intervals) of factors that are significant associated with TB infections among MMT entrants. The top dashed line denotes the scale for the continuous variables, whereas the bottom solid line denotes that for categorical variables.
