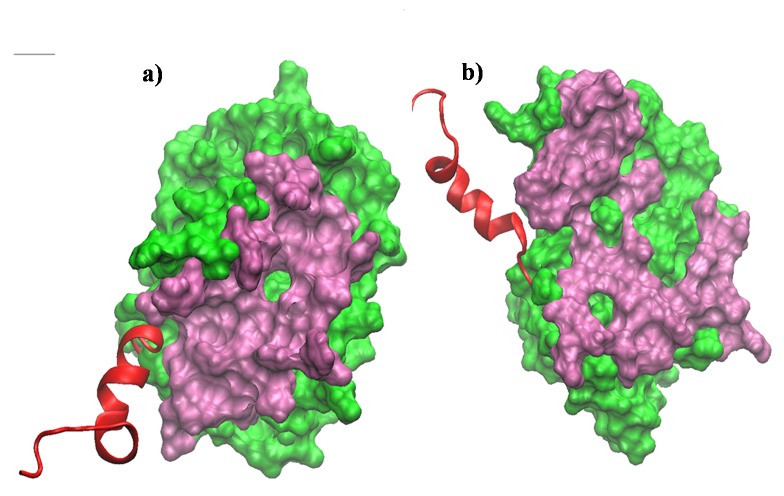
Figure 6. Exposure of the binding pocket, in surface representation.
Structures of Bcl-xl without BH3Bak (a) at the starting of the simulation and (b) after 100 ns simulation. The core residues (residue 1 to 196) are shown in green surface and the c-terminal (residue 197 to 217) in red ribbon. The active site residues (which were at a distance 5 Å from the BH3Bak in the NMR structure) are shown in mauve.

