
Figure 10. Distribution of the conformations along first three principal components.
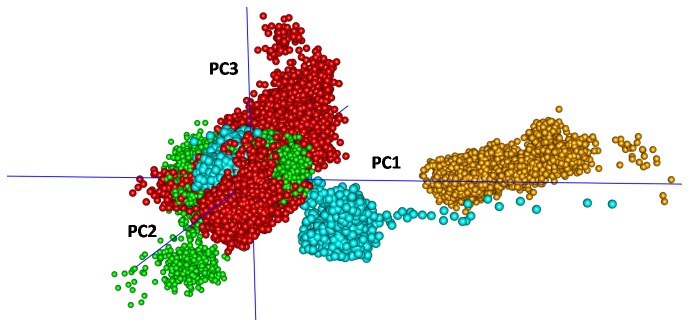
Different colors were used to show points from different trajectories: Bcl-xl in water (cyan), in membrane (red) and complex in water (green) and in membrane (orange). Also see Movie S7 to view from different sides.