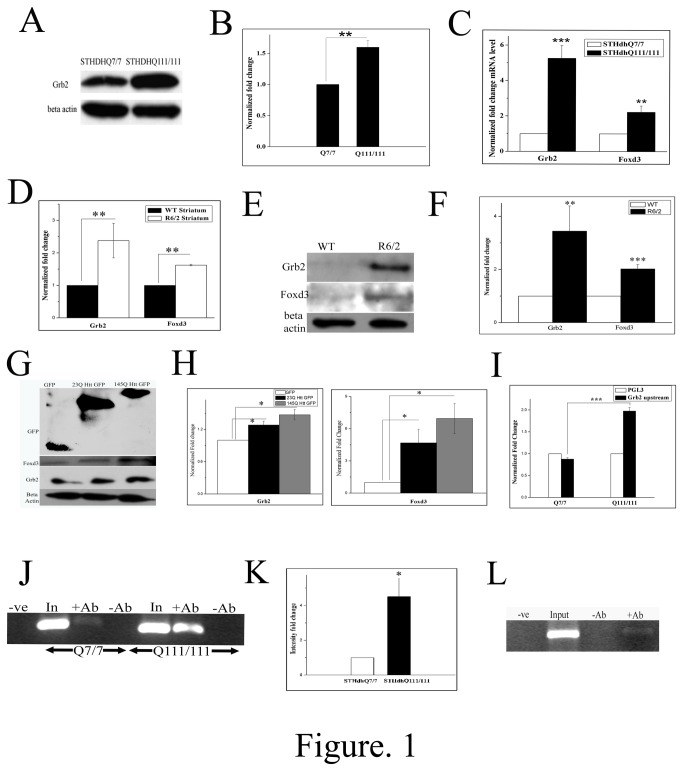
Figure 1. Grb2 is upregulated and is regulated by Foxd3 in Huntington’s disease condition.
A. Representative Western blot of three (n=3) independent experiments for Grb2 and beta actin expression in STHdhQ7/7 and STHdhQ111/111 cells. Expression of beta actin was taken as internal control. B. Bar diagram representing the mean optical density of bands obtained in A normalized to that of beta actin (p< 0.01). C. Normalized fold changes of Grb2 and Foxd3 mRNA levels of three independent real time PCR experiments in STHdhQ111/111 with respect to STHdhQ7/7, beta actin taken as internal control (n=3, p<0.001, and p<0.01 respectively). D. Grb2 and Foxd3 normalized fold change mRNA expression levels in striatum tissues of wild type and R6/2 age matched mice, beta actin taken as internal control. Data of three independent experiments (Grb2; p<0.01; Foxd3 p<0.01, n=3). E. Western blot showing Grb2, Foxd3 and beta actin levels in striatum tissues of age matched control and R6/2 mice F. Bar diagram of four (n=4; Grb2 p<0.01; Foxd3 p<0.001) independent samples as shown in E. G. Western blot representative picture of GFP, Grb2, Foxd3 and beta actin (loading control) expression levels in Neuro2A cells transfected with GFP, 23Q Httex1 and 145QHttex1 GFP respectively. H. Bar diagram of expression levels of Grb2 and Foxd3 normalized to that of beta actin as shown in panel H. of three independent experiments (p<0.05,n=3). I. Luciferase reporter assay (n=3) of the Grb2 upstream sequence cloned in pGL3 vector in empty GFP transfected STHdhQ7/7 and GFP transfected STHdhQ111/111 cells. Luciferase activity of above cells was normalized by the luciferase activity of the corresponding empty pGL3 vector transfected cells (p<0.001). J. Comparative ChIP analysis showing relative occupancy of endogenous Foxd3 in Grb2 promoter was more in STHdhQ111/111 cells compared to STHdhQ7/7 cells. Immunoprecipitation was carried out with anti-Foxd3 antibody and the immunoprecipitated DNA was PCR amplified using primers specific for Grb2 upstream sequence (n=3). K. Bar diagram of normalized fold change of intensity of immunoprecipitated DNA as shown in panel J. Data of three independent experiment (n=3, p<0.05). L. Representative agarose gel picture of ChIP analysis (n=3) showing occupancy of endogenous Foxd3 in Grb2 promoter in Neuro2A cell.

