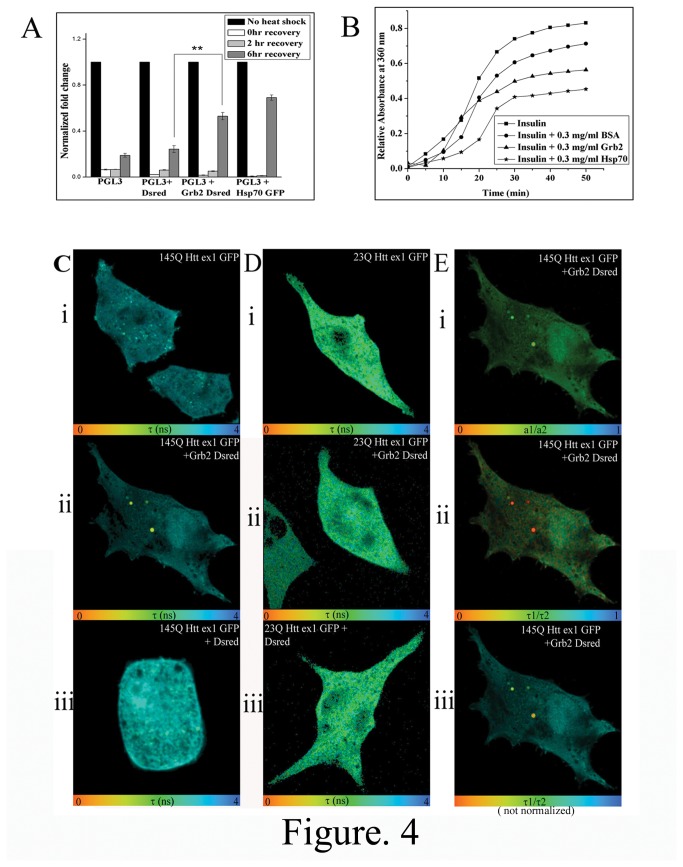
Figure 4. Localized interaction between Htt and Grb2 and Chaperone potential of Grb2.
A. Normalized fold change of luciferase signal of cells transfected with pGL3 basic vector, pGL3 vector plus Dsred empty vector, pGL3 basic vector plus Grb2-Dsred and pGL3 vector plus Hsp70 GFP, all of the cells given heat shock for 1 hour and recovery at 37°C for 0hr, 2hr and 6hr. Fold change was calculated taking no heat shock cells as a control. B. Change in relative absorbance at 360nm with time was plotted for insulin with DTT alone or, in presence of 0.3mg/ml BSA, 0.3mg/ml Grb2, and 0.3mg/ml Hsp70. C. Fluorescence lifetime images of 145Q Httex1 GFP in cells transfected with i. 145Q Httex1 GFP, ii. co-transfected with 145Q Httex1 GFP and Grb2-Dsred and iii.co-transfected with 145Q Httex1 GFP and DsredC1. D. Fluorescence lifetime images of 23Q Httex1 GFP in cells transfected with i. 23Q Httex1 GFP, ii. Co-transfected with 23Q Httex1 GFP and Grb2-Dsred C and iii. co-transfected with 23Q Httex1 GFP and DsredC1. E. Analysis of cells co-transfected with 145Q Httex1 GFP and Grb2-Dsred i. a1/a2 image shows the ratio of interacting and non interacting species within the cell, ii and iii (normalized and not normalized images respectively) shows τ1/τ2 images in different scales showing the ratio of GFP two lifetime species within the cell.

