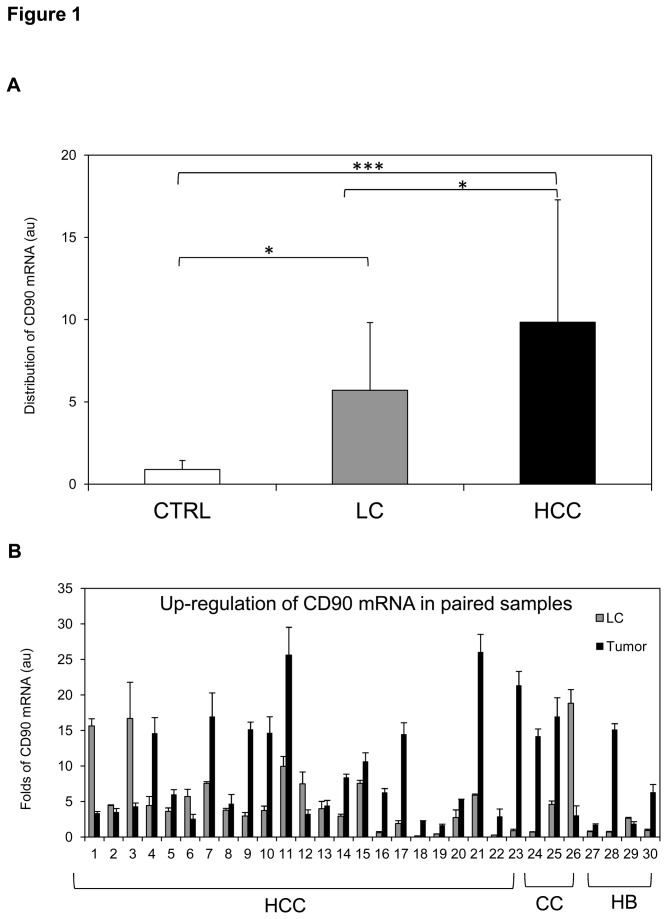
Figure 1. The mRNA expression of CD90/Thy-1 in primary liver cancer by RT-qPCR analysis.
A. CD90 distribution in normal liver CTRL (n=12), liver cirrhosis LC of HCC (n=26) and HCC (n=25). Statistical analysis was performed using one-way ANOVA with Bonferroni post-test (*p<0.05, ***p<0.001). Data represented mean ± SD. B. CD90 gene up-regulation in paired individuals of HCC (1-23), cholangiocarcinoma (CC, 24-26), and hepatoblastoma (HB, 27-30). CD90 mRNA relative expression was normalized to reference genes 18SRNA and β-actin; the expression of a normal sample was considered as 1.00 au.

