
Figure 1. Characterization of mitochondrial SO flashes in NPCs.
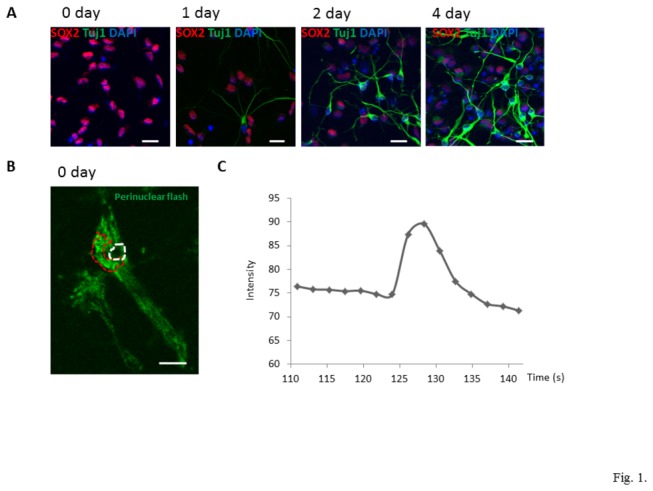
(A) Cell differentiation was induced by growth factor removal. NPCs and neurons were identified by antibodies against Sox2 (red) and Tuj1 (green), respectively, at different days of differentiation. The nuclei of NPCs were counterstained with DAPI (blue). Bar = 20 µm. (B-C) Characteristics of typical mitochondrial SO flashes in NPCs (day 0). The area circumscribed with the red dashed line is a perinuclear region where SO flashes occurred, and the area circumscribed with the white dashed line is the nucleus. Bar = 5µm (B). Change of mt-cpYFP fluorescence intensity during time course of a typical SO flash (C).