
Figure 4. Expression of mitochondrial proteins in NPCs during differentiation.
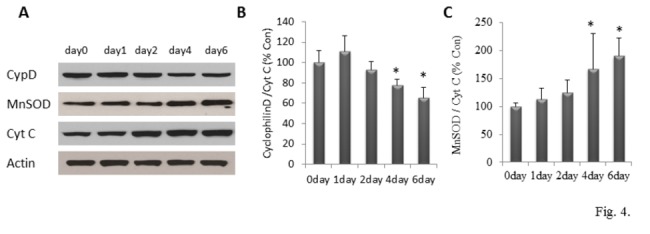
(A, B and C) Immunoblot analysis was performed by using antibodies that selectively recognize cytochrome c, MnSOD and cyclophylin D. Blots were reprobed with antibodies against Actin. Panel A shows representative blots; panels B and C show results of densitometric analysis of cyclophylin D and MnSOD, which were normalized to the corresponding mitochondrial cytochrome c level on each differentiation day. Values are expressed as a percentage of the mean of NPCs at day 0 (n = 3-4 separate experiments performed on cells cultured from 3-4 pregnant mice); *p<0.05 compared to the values of NPCs at day 0.