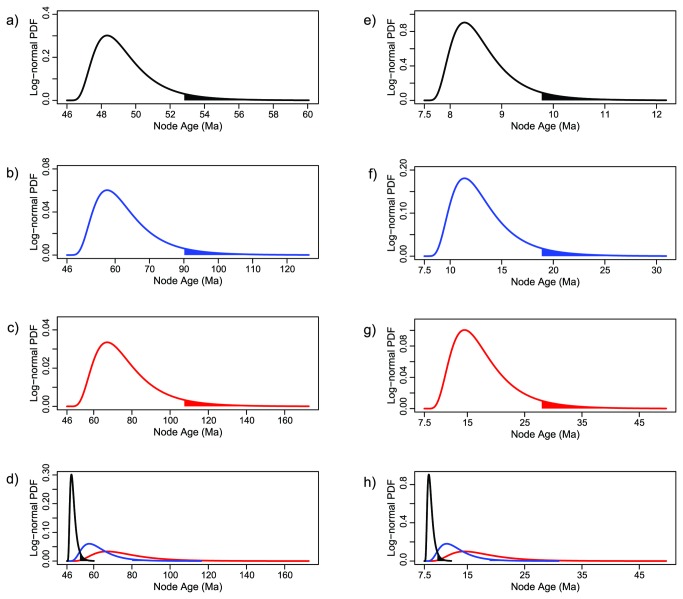
Figure 3. Alternative priors of fossil-calibrated nodes used in the sensitivity analysis.
Log-normally distributed calibration priors for the age of the MRCA of Citharinoidei (a-d) and Distichodus (e-h) as plotted separately and differentially scaled (a-c, e-g), and combined and equally scaled (d, h). The lower limit of the x-axis interval defining the area shaded under the curves corresponds to the 95th percentile soft maximum bound of each calibration prior.

